AntV turns a small text grammar into editable SVG
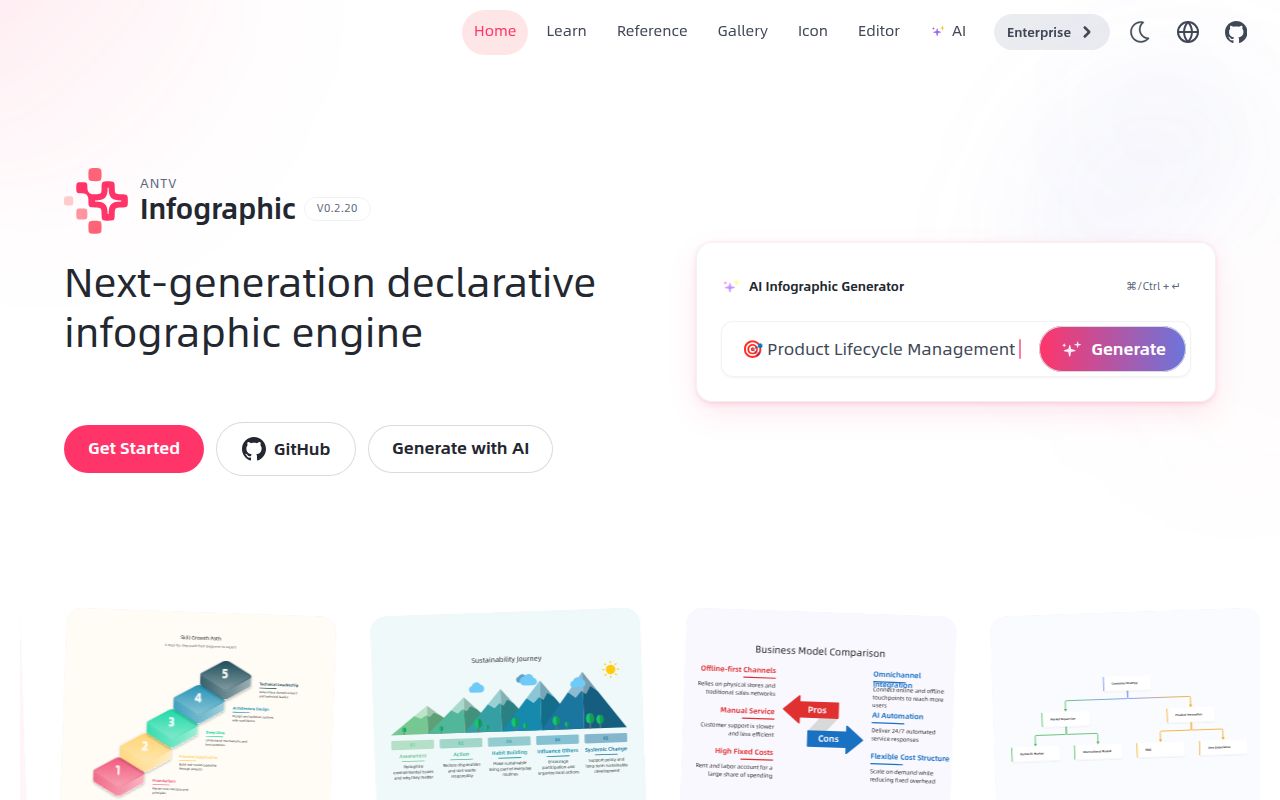
AntV Infographic accepts a template name plus indented data and renders the result as SVG. The quick start creates an Infographic instance in a browser container, sets width and height, enables editing, and passes a short list specification to render. That is a useful middle ground between drawing a graphic manually and asking an image model for pixels that are hard to correct. Labels and structure remain available to code.
The README says the package includes roughly 200 templates, along with data items, layouts, themes, gradients, patterns, and hand-drawn styles. Output defaults to SVG, which supports crisp scaling and later editing. A built-in editor lets a person adjust an AI-produced result. The source format is AntV's own infographic syntax, so the library is most attractive when its template vocabulary matches the story being told.
Partial AI output can render before the response finishes
Streaming support is unusually practical. An application can append each model chunk to a buffer and call render again, allowing a partial infographic to appear while the syntax is still arriving. The grammar is designed to tolerate incomplete output. That gives AI interfaces visible progress without waiting for a final image-generation job or parsing a complete JSON document first.
Tolerance should not be mistaken for semantic validation. A graphic can render while a field is missing or attached to a template that ignores it. Issue 211 reports that skill examples supplied a value field to many diagrams that did not support it, leaving data absent from generated results. A production workflow should compare the source facts with the final SVG text and require a person to review high-stakes figures.
What happened when we ran it
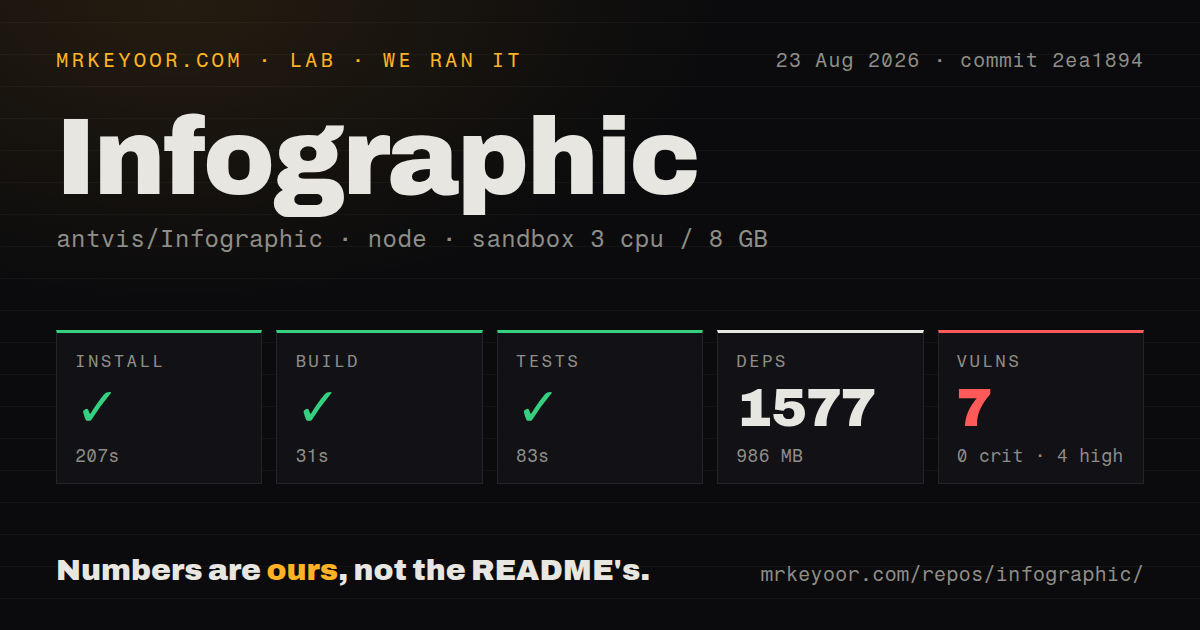
Our Node 22 Debian sandbox installed 1,577 npm packages in 207 seconds. The installed tree used 986 MB. The build completed successfully in 31 seconds, and the provided test step also succeeded in 83 seconds. The lab block did not provide a test count, so a precise number of cases cannot be claimed.
Npm audit found 7 known vulnerabilities: 0 critical, 4 high, 2 moderate, and 1 low. Those findings do not prove that the browser bundle exposes every affected package, but they do require dependency tracing before deployment. The source checkout itself was much smaller at 3.3 MB, with 778 files and about 75,141 lines of source.
The repository had 3 CI workflow files, no Dockerfile, a tests directory, and npm workspaces. Our run establishes that commit 2ea1894 installed, built, and completed its supplied tests in a fresh unprivileged container with 3 CPUs and 8 GB of RAM. It does not measure browser frame rate, SVG complexity, export fidelity, or the correctness of AI-generated content.
The custom syntax is easier to generate and harder to move
For an AI agent, the syntax is concise enough to learn from examples. A list infographic can be expressed with a template identifier, a data block, and repeated labels and descriptions. That is less brittle than demanding that a model write a complete SVG tree. The repository also provides skills for creating syntax, structures, items, HTML files, and template updates.
Portability is the tradeoff. Mermaid source is understood by many documentation platforms, and Vega-Lite specifications have a mature analytical visualization ecosystem. AntV's source belongs to this renderer. SVG export keeps the final picture portable, but editing the underlying data-to-layout relationship later still depends on AntV. Teams should store the original syntax beside the exported asset and pin the package version used to render it.
Claude Code skills help author output but add another version boundary
The README documents a Claude Code marketplace plugin and manual skill installation from release archives. Codex users can install individual repository skills. These assets teach an agent to choose templates and produce the expected syntax, which is useful because template rules are more specific than ordinary chart JSON. The claude-code tag applies to these skills, not to the core renderer itself.
Skills and renderer releases can drift. The manual example even tells users to replace an older version placeholder with the latest tag. Pin both sides together, test the examples against that renderer, and inspect any skill update before giving it access to a repository. An agent that emits accepted syntax may still choose a poor layout or omit a value, so visual approval remains part of the job.
Version 0.2.19 is active despite a small issue queue
GitHub showed 6,386 stars, 20 combined issues and pull requests, and a last push on August 21, 2026. Release 0.2.19 was published on May 6 and included Shadow Root editor support plus a fix for multiline text truncation and width errors in PNG export. An August pull request added letter and word spacing support, showing work after the release.
Current issues reveal where the boundaries still move. Issue 248 asks about architecture diagrams, and issue 249 argues that the available template selection remains too small for some users despite the README's roughly 200-template claim. These are different perspectives on coverage: 200 is large for a starter library, while a visual product can still exhaust it quickly across many domains.
AntV Infographic earns a trial for an AI writing or presentation tool that needs editable, streamed visual output. Our passing build and test step support that trial. The 986 MB install and 7 audit findings make it expensive for a decorative one-off, and the custom grammar creates a lasting dependency. Pick it because the templates and editor are part of the product, then verify the data in every rendered graphic.