ECharts 6.1.0 is a visualization system, not a chart widget
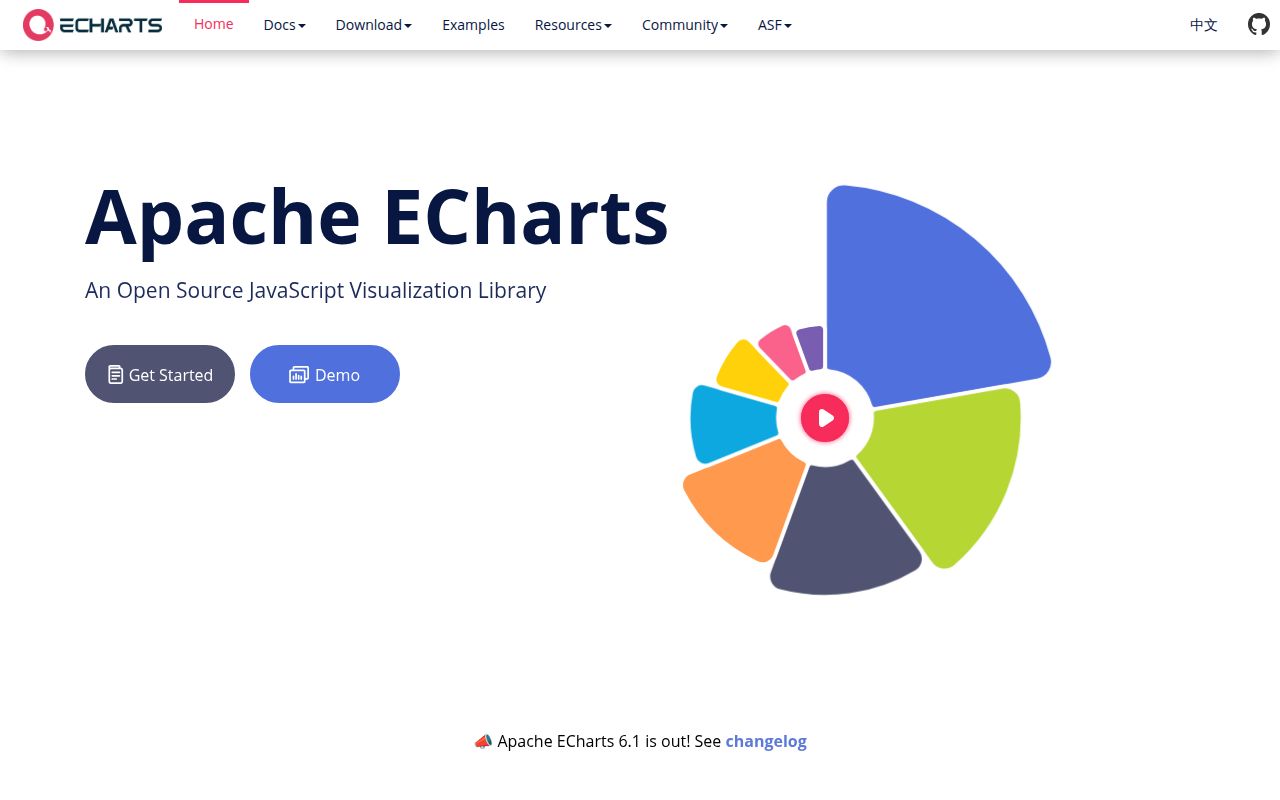
ECharts 6.1.0 covers the familiar bar, line, pie, scatter, and candlestick work, then keeps going into graphs, trees, radar, parallel coordinates, maps, visual mapping, data zoom, transforms, and custom series. Options describe data, axes, layout, styling, and interaction, while the library handles rendering and updates. That range suits a dashboard builder or analytics product where the next request may be a heat map, a linked brush, or a chart type nobody planned for in the first sprint.
Breadth also means a large option vocabulary. The official site splits guidance across a handbook, API reference, option manual, and examples gallery because a single getting-started page cannot explain this system. Version 6.1.0 alone added axis behavior, matrix events, radar direction, candlestick cursors, and more, while correcting many chart-specific cases. Teams should create shared option builders and visual regression fixtures rather than letting every feature team invent its own ECharts conventions.
Tree-shaken imports make the large API manageable
The simplest import loads all ECharts functionality. The documented modular route starts from echarts/core, then registers only the charts, components, features, and Canvas or SVG renderer the product uses. That choice keeps an application from shipping code for unused chart types. It also makes missing registration a possible runtime mistake, so the component list belongs in one reviewed module instead of being repeated across screens.
TypeScript users can define a narrower option type from the chosen series and component types. That is useful because a product with 6 chart families does not need every possible option accepted everywhere. The sample editor can generate modular import code for a working example. Framework integration remains separate from the core: the README points Vue users to vue-echarts, while React teams generally choose their own wrapper or manage the instance lifecycle directly.
What happened when we ran it
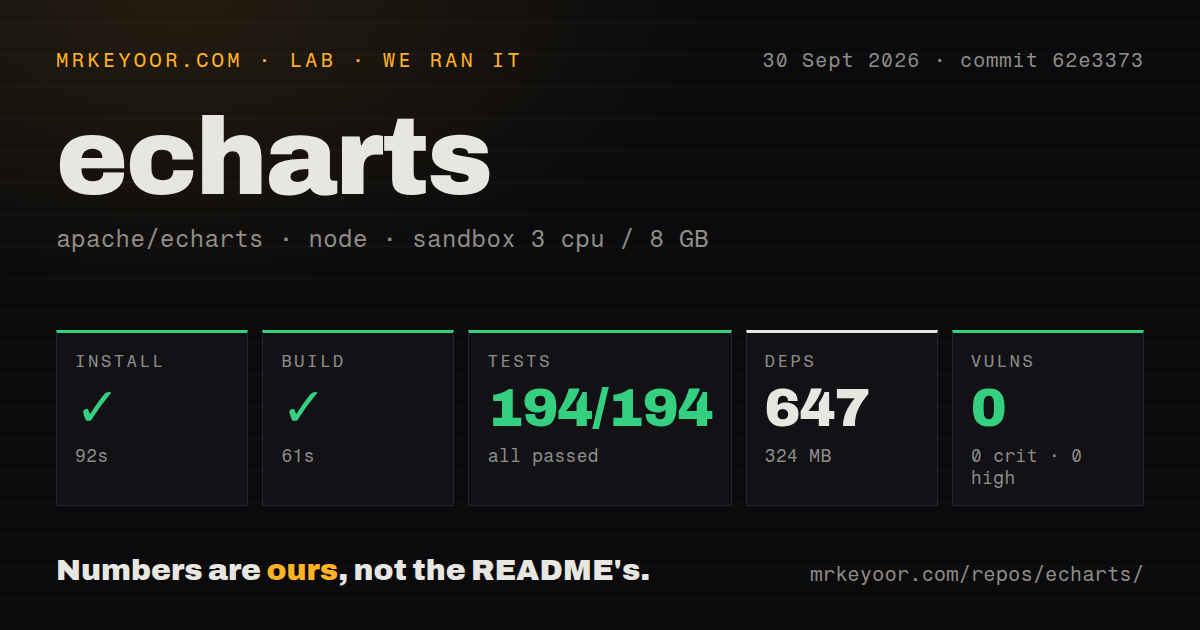
Our sandbox installed commit 62e3373 in 92 seconds, pulling 647 packages and occupying 324 MB. The build completed successfully in 61 seconds. We used an unprivileged container with 3 CPUs, 8 GB of RAM, Node 22, and no secrets. Npm audit reported 0 known vulnerabilities across critical, high, moderate, and low severity. This run measured repository health, not frame rate or browser memory use.
The Jest step passed in 116 seconds with 194 passed and 0 failed. Unlike a visual spot check, those tests give contributors a clean starting point for code changes at the measured commit. The repository contained 2,157 files, around 216,153 source lines, and 44.3 MB before installation. Our scan also found 6 CI workflow files and a tests directory. There is no Dockerfile, which is reasonable for a browser library distributed through npm and CDNs.
Canvas suits dense plots while SVG helps documents and SSR
ECharts has supported an SVG renderer since v4.0, alongside its default Canvas renderer. The handbook recommends Canvas for charts with many elements and describes SVG as lighter on memory in some mobile cases, crisp when zoomed, and useful for server output. This is an application decision, not a universal winner. Test the renderer with the actual point count, device class, hover behavior, export path, and number of chart instances on one page.
An open 6.0.0 issue makes that tradeoff concrete. Its reproduction reports SVG legend emphasis becoming delayed or unresponsive at roughly 3,000 line points when symbols remain enabled, while chart-body tooltips still work. The reporter's workaround disables symbols and optionally adds sampling. That report is not our benchmark, but it is a good preflight case for monitoring screens that combine dense series, SVG, and legend hover.
Server-side rendering can return an SVG string without a DOM container. Since v5.3.0, that path has no rendering dependency and can embed initial animation as CSS. Fixed width and height are still required, and some interactive animation cannot work in static output. Canvas SSR needs a Canvas implementation such as node-canvas. For interactive first paint, the handbook describes hydration and a lightweight client runtime rather than pretending a static image behaves like a browser chart.
ARIA stays off until the application enables it
ECharts has generated chart descriptions since version 4, and version 5 added decal patterns for distinctions beyond color. Yet accessibility is disabled by default. A modular build must import AriaComponent, then set aria.show to true. The generated label can help with a simple chart, but the handbook warns that a default description listing many scatter points can become too long to understand. Complex charts need a human-written description and nonvisual access to the underlying data.
Input behavior needs the same care. Open issue 21740 reports pinch zoom and double-tap zoom failing to emit data-zoom events on a Windows 11 touch laptop and HMI setup with ECharts 6.0.0 and 6.1.0. One report does not define every touch device, but it identifies a test your team should run before shipping a kiosk. Keyboard flow, tooltip access, focus order, contrast, and reduced-motion behavior remain application responsibilities.
The September push matters more than the May release date
GitHub showed 67,422 stars, 1,298 open issues, and 196 open pull requests on September 30, 2026. The repository was pushed that day, and a same-day bug report already had a linked pull request. Release 6.1.0 arrived on May 19, but the later commit and issue activity show continuing work. The large queue reflects both age and surface area; it should be triaged by the chart types and environments your product will use.
Read the 6.1.0 notes before upgrading. They document three behavior breaks from 6.0.0 involving tooltip indices, axis start values, and edge overflow for several Cartesian series. That candor is useful, but a minor version with listed breaks deserves screenshot tests and interaction checks. ECharts earns adoption when its range replaces several narrower packages. Our 194 passing tests make the codebase credible; your own chart fixtures decide whether that range works for the product.