Version 1.1 turns x64dbg into an 84-tool MCP endpoint
x64dbg-MCP Server loads inside x64dbg and exposes debugger operations as Model Context Protocol tools. An assistant can load or attach to a program, run it, wait for pauses, step through instructions, read registers, inspect threads and modules, search memory, analyze PE structures, and work with symbols. More invasive calls can allocate or write memory, assemble instructions, manage breakpoints, dump modules, and execute arbitrary x64dbg commands.
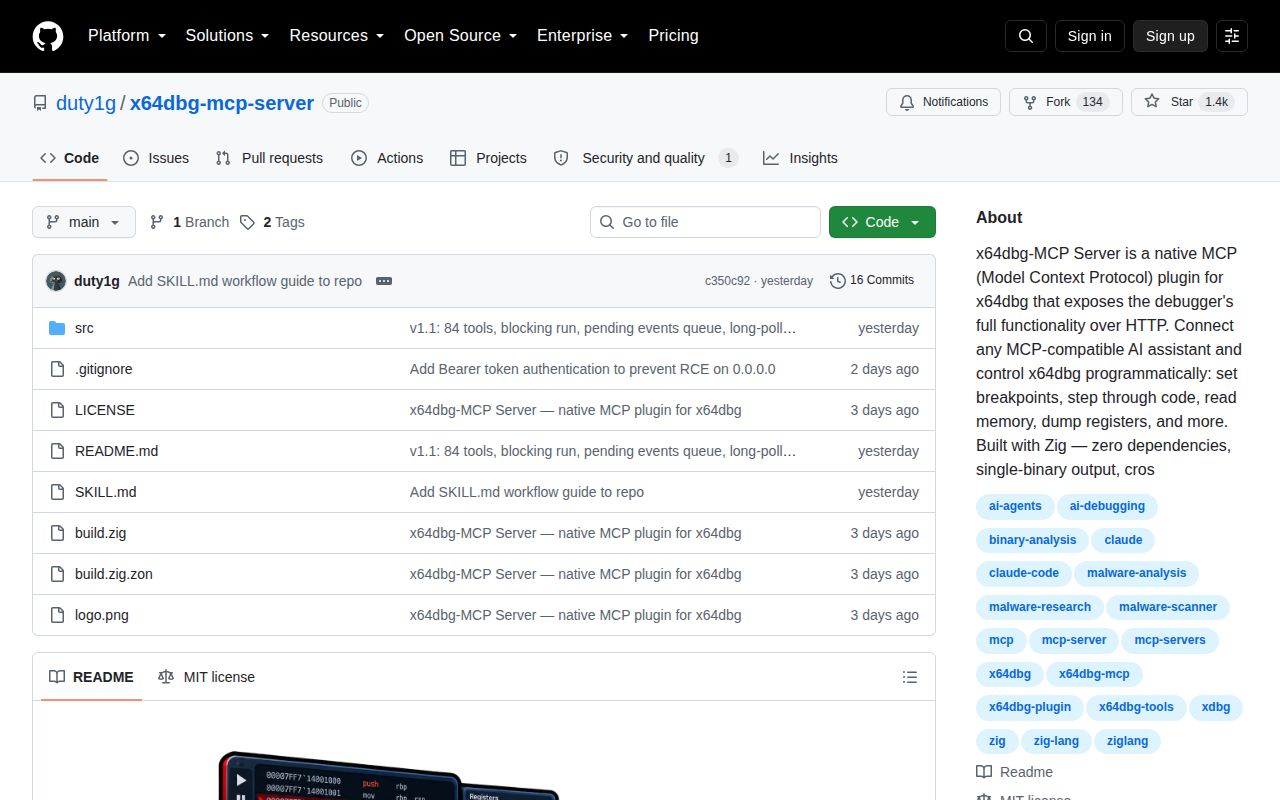
The v1.1 release increased the tool count from 72 to 84 and added 12 tools for events, memory and exception breakpoints, tracing, code analysis, breakpoint commands, and database saving. It also changed run to block until the target pauses, with a default of 5 minutes and a maximum of 10 minutes. That behavior is designed for request-response clients that would otherwise lose track of a running debuggee.
Native integration removes a runtime and increases the blast radius
The plugin is written in Zig and resolves x64dbg API symbols from the debugger's DLLs at runtime. Its HTTP server runs on a background thread inside the x64dbg process, so there is no Python service or .NET bridge to install. Release output contains both .dp32 and .dp64 plugins, and the source build cross-compiles both Windows targets from one command.
In-process access is efficient, but a server bug shares a process with the debugger. More importantly, every accepted tool call reaches a live analysis environment. A prompt mistake can resume a sample, delete breakpoints, alter a register, patch bytes, or dump memory to disk. The 84-tool surface is useful precisely because it is powerful. Analysts should save databases, keep sample snapshots, and review destructive calls rather than letting an assistant operate unattended.
The default listener needs to be narrowed before first use
Bearer authentication is mandatory. The plugin generates a token on first run, rejects missing or invalid credentials with HTTP 401, and lets users rotate or copy the token from a configuration dialog. That is better than an unauthenticated debug endpoint. It is still only one control around a service that can write memory and execute debugger commands.
The README lists 0.0.0.0:9094 for x64 and 0.0.0.0:9095 for x32, which exposes the listener on every interface. It also states that HTTP traffic is unencrypted. On a normal workstation, change the bind address to 127.0.0.1 before adding the MCP client. A remote or WSL connection should sit behind host firewall rules and a protected tunnel; sending the bearer token over an untrusted network defeats the token.
MCP clients also need careful scoping. Put this server in a profile used only for an authorized lab rather than a global configuration loaded for everyday chats. The tool list includes target manipulation, and tool descriptions do not substitute for a human approval policy. If an assistant only needs analysis output, a smaller read-only adapter would offer a safer contract, but this project does not advertise such a mode.
What happened when we ran it
We did not execute the repository in our sandbox. The lab has no supported runner for its Zig ecosystem, and the repository contains no Dockerfile that could provide another standardized path. There are therefore no MrKeyoor measurements for install time, compilation, tests, dependency footprint, or known vulnerabilities. The absence of a run should not be mistaken for a successful cross-compile.
The documented build requires Zig 0.16-dev or later and produces Windows plugins from Windows, WSL, Linux, or macOS. A real functional test then needs x64dbg on Windows, a target process, and an MCP client speaking streamable HTTP or legacy SSE. Those requirements are specific enough to make a future Windows harness useful, but our generic container did not meet them.
Readers should also notice a documentation mismatch. The feature list and v1.1 release say 84 tools, while the Tools section still opens by saying 72 before listing newer entries such as WaitForEvent. The release notes resolve the current count, but the stale line makes the README less reliable for clients that budget tool-schema context or audit exposed operations.
Active development does not yet equal a hardened control plane
Release v1.1 and the last repository push both landed on August 24, 2026. GitHub showed zero open issues and pull requests during our research. A clean queue can mean bugs are handled quickly or that the user base is still early; it is not proof that an 84-tool debugger bridge has received deep adversarial testing. The MIT license and single-command build lower the barrier to independent review.
The README is unusually candid about intended use and network risk. It limits the project to authorized reverse engineering, malware analysis, security research, and education, then warns users not to expose the server to untrusted networks. The architecture and source tree are small enough to inspect compared with a multi-process bridge. Security teams should still review request parsing, authentication comparisons, thread interaction, and every write-capable handler before deployment.
x64dbg-MCP Server earns a trial when an experienced analyst wants an assistant to carry out a known debugging plan. It should not give an inexperienced model unsupervised authority over an unknown sample. Start on a disposable Windows VM, bind to loopback, restrict the MCP profile, and watch each state-changing call. If the job is mostly static analysis or human-led stepping, Ghidra or plain x64dbg keeps a risky network control surface out of the workflow.