x64dbg is for live Windows binaries without source code
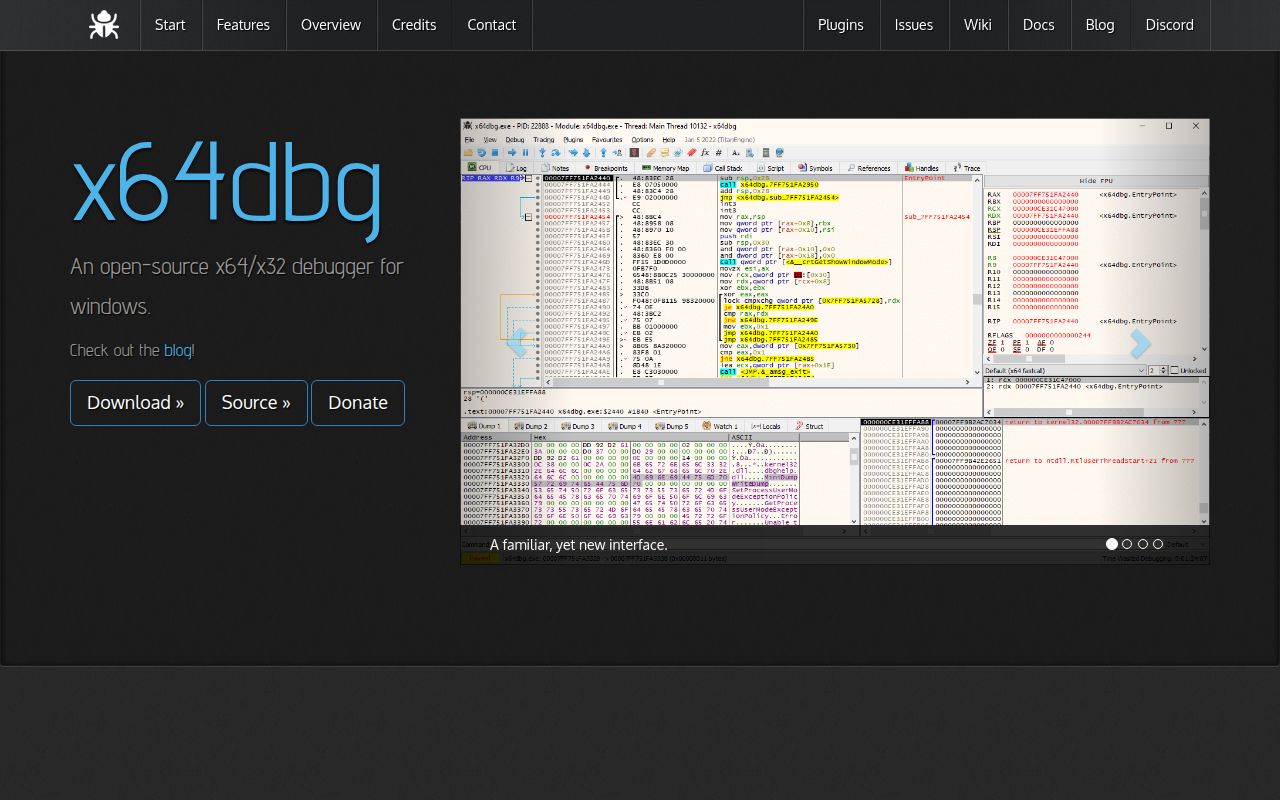
x64dbg handles 32-bit and 64-bit Windows EXE and DLL files in user mode. Open an unfamiliar binary and the main CPU view puts its disassembly, registers, stack, memory dump, and watches in one workspace. You can attach to a process, inspect modules and threads, use basic PDB symbols, patch an executable, or save your findings in its JSON database. The tool is organized around watching compiled code behave.
The split between x32dbg.exe and x64dbg.exe is deliberate. The included x96dbg.exe launcher chooses the matching architecture. x64dbg is aimed at malware analysts, reverse engineers, and exploit developers who often begin with a binary rather than a buildable project. It does not present itself as a kernel debugger.
Conditional tracing can turn a breakpoint into a data collector
A conditional breakpoint can inspect an expression, count hits, write a formatted log line, run a command, and resume without stopping in the GUI. Examples include breaking on the third hit, matching a thread ID, and checking whether a register points to a UTF-16 string containing specific text. Invalid expressions trigger the condition. Numeric literals are hexadecimal by default, so .123 is required when you mean decimal 123.
Trace recording saves stepped instructions with registers and memory accesses. You can search the file for a constant or address, reopen it later, and connect coverage to the control-flow graph. That helps when a breakpoint fires too often or the interesting state appears along a path you cannot name in advance. Trace-over skips activity inside calls, while trace-into observes it at a higher runtime cost.
What happened when we ran it
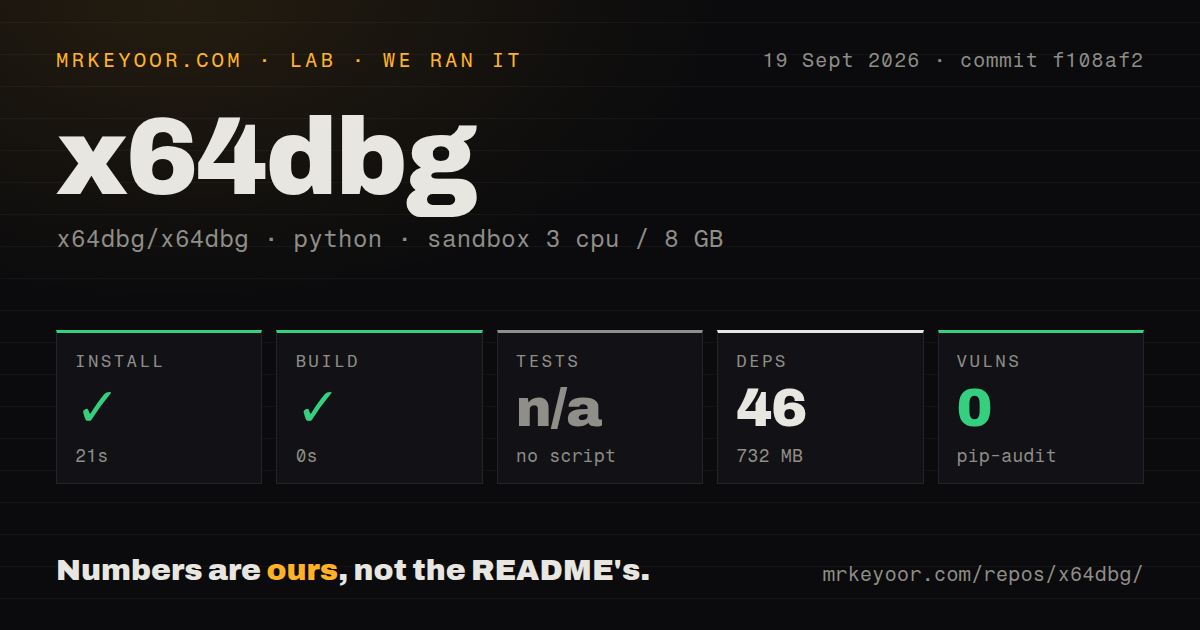
Our sandbox found the Python project under src/cross/remote_server/. Installing that project took 21 seconds, pulled 46 packages, and left 732 MB on disk. Its build step succeeded in 0 seconds. Pip-audit reported 0 known vulnerabilities in the installed Python environment. These results came from commit f108af2 in an unprivileged Debian container with 3 CPUs and 8 GB of RAM.
No test script or target was available to the lab runner, so it skipped tests. The checkout contained 2,542 files, about 347,122 lines of source, and occupied 65.7 MB before the installed environment. The scan found 3 CI workflow files, no Dockerfile, and no tests directory. Most importantly, this was not a successful build or launch of the main Windows desktop debugger.
A release snapshot is easier than compiling the debugger
The user path is short: download a snapshot, extract it into a directory your account can write to, and open the executable for the target architecture. No account or remote service is part of that path. For source work, the compilation guide asks for Visual Studio with the Desktop development for C++ workload, CMake, Git, and a recursive clone. Separate CMake configurations produce x86 and x64 builds.
Linux does not turn that into an ordinary native package build. The documented route installs CMake, Ninja, and Wine, then obtains Microsoft's compiler through msvc-wine with ATL. It also requires architecture-specific environment variables. The May 27, 2026 release mentions experimental Linux debugger updates, while the main README still describes a Windows debugger. Treat that Linux work as an experiment unless your own target workflow proves otherwise.
Plugins extend the tool under an unusual GPL exception
The plugin catalog covers anti-anti-debugging, trace parsing, symbol work, scripting, and patch handling. It also links x64dbg to IDA, Binary Ninja, Ghidra, and Cutter. Official templates cover a native plugin and a Qt tab, while the wiki points to community examples for C#, Rust, Delphi, and assembler. Plugins can fill a repeated gap in the base debugger.
Read the license before distributing a modified build. The repository contains a modified GPLv3 text with a specific exception allowing non-standalone x64dbg plugins, including closed-source commercial plugins, to use their own licenses. GitHub's API returned NOASSERTION for the repository license rather than a standard SPDX identifier. Plugin authors get useful room, but product teams should not infer the terms from the GPL filename alone.
Whole-page memory breakpoints remain a hard limit
The official limitations page names one concrete gap: a memory breakpoint covers an entire memory page rather than a smaller range inside it. That can produce extra stops when unrelated data shares the page. The conditional system can filter what happens after a hit, but it does not make the underlying watch range finer. Anyone tracking a small structure in a busy page should try the exact target before committing to this debugger.
September activity outweighs the older release tag
The repository was pushed on September 19, 2026, the same date as lab commit f108af2. GitHub showed 49,559 stars, while separate searches returned 563 open issues and 8 open pull requests. That queue is substantial. It is also active: an issue about label deletion was opened and closed on September 17, and several corrective pull requests merged on September 19.
The latest tagged release, 2026.05.27, fixed an r8 register edit, a trace-reader memory fault, dark-theme label color, and absolute paths passed to -cf. A May tag alone would tell little about health. The September push and same-week issue movement show ongoing maintenance, while 571 open items warn that your particular edge case may still need investigation.
Choose x64dbg when the target is a Windows process
Pick x64dbg when you need to stop, inspect, trace, and patch a 32-bit or 64-bit Windows program without its source. Ghidra and Cutter are stronger starting points for cross-platform static analysis, while WinDbg is the direct alternative for kernel and driver work. The easy number to misread is our 21-second install: it belongs to the Python remote server. Budget the desktop debugger as a Windows reverse-engineering environment with its own compiler, plugins, and operating assumptions.