v0.140.0 puts five observability jobs in one interface
SigNoz v0.140.0 combines logs, metrics, traces, alerts, and dashboards around OpenTelemetry data. Its APM views cover service latency, errors, throughput, endpoints, database calls, and external calls. Infrastructure screens cover Kubernetes and host telemetry, while LLM views track spans, tool calls, tokens, latency, and cost. The practical appeal is correlation: an operator can move between a service chart, its traces, related logs, and an alert without maintaining a separate user experience for each signal.
The product still needs good telemetry. Applications must emit OpenTelemetry data or use a supported Prometheus, language, framework, database, cloud, or infrastructure integration. Field names, sampling, cardinality, and retention choices determine whether a query answers an incident question or burns storage on noise. SigNoz gives those signals one query and presentation layer. It cannot repair missing spans, inconsistent service names, or logs that omit the request identifier needed for correlation.
The 1,245-package source install is only the first layer
Our commit e0da06f checkout contained 7,687 files and about 1,016,007 source lines in 60.1 MB. Installing its Go dependencies pulled 1,245 packages in 181 seconds. The repository is plainly a product codebase rather than a small collector or embeddable chart component. That matters during upgrades: frontend, query, ingestion, storage, authorization, integrations, and deployment changes can arrive together, so staging the release against representative telemetry is worth the extra machine.
The README splits adoption into managed Cloud, Enterprise, and Community. Community can run through Foundry, Docker, Kubernetes, or Linux, while the managed route removes the backend from your on-call list. Self-hosting keeps control of the data plane and makes your team responsible for storage capacity, backups, retention, upgrades, ingress, authentication, and alert delivery. The root repository has no Dockerfile, so follow the linked deployment path rather than treating the successful source build as an installation guide.
What happened when we ran it
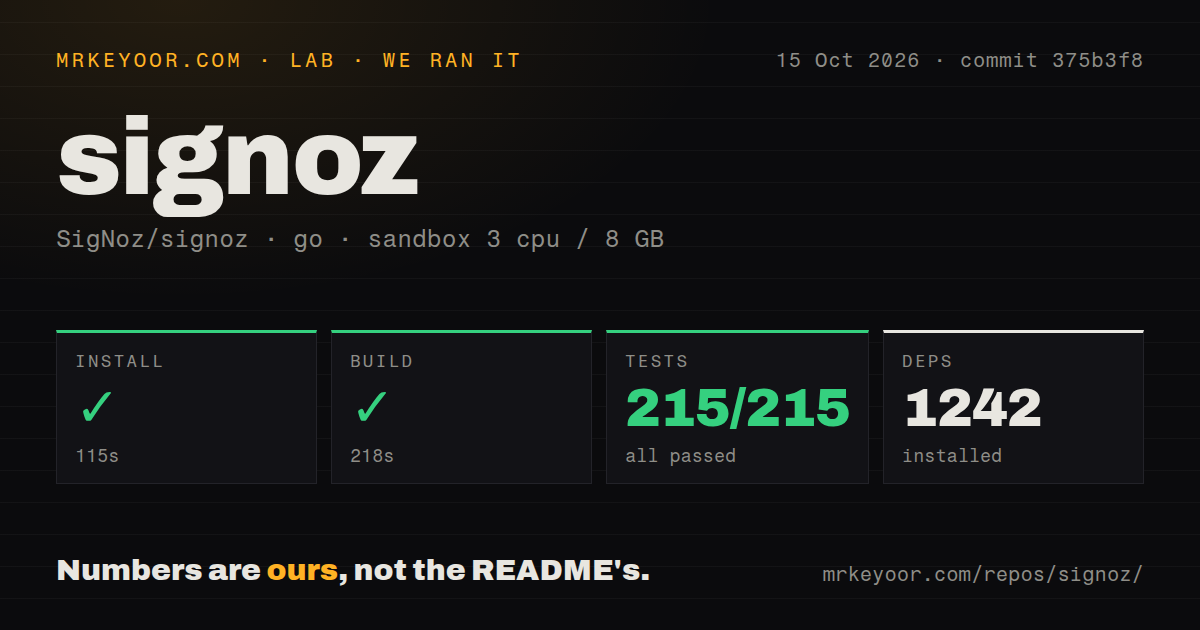
Our sandbox installed 1,245 packages in 181 seconds and completed the build in 204 seconds. The test step took 145 seconds, with Go reporting 206 passed and 0 failed out of 206. The checkout also contained 17 CI workflow files and a tests directory. On repository mechanics, this was the cleanest result in this group: every measured command completed successfully in an unprivileged Debian container with 3 CPUs and 8 GB of RAM.
Those 530 seconds of install, build, and test time did not constitute a production trial. We did not start the storage layer, send logs or spans, create alerts, test dashboards, simulate retention pressure, or perform an upgrade. No throughput, query-latency, or resource claim follows from the passing suite. A useful proof of concept should send real OpenTelemetry data, break one service intentionally, and check whether the team can move from an alert to the relevant trace and logs.
The 206 passing tests do not cover your telemetry design
All 206 reported Go tests passed, yet the harder adoption work sits at the boundary between SDKs, collectors, storage, and people. Decide which service and deployment attributes are mandatory, how traces are sampled, which log fields are indexed, and who owns an alert after it fires. High-cardinality telemetry can be useful, but it needs cost and retention controls. SigNoz supports Query Builder, PromQL, and ClickHouse SQL; that range also means teams need conventions for which query path belongs in shared dashboards.
The official agent integration extends the same access question. SigNoz documents an MCP server and a plugin for Claude Code, Codex, Cursor, and other coding agents. That can bring production context into an incident session, but the agent still receives whatever its SigNoz identity can query or change. Treat the endpoint and credentials like observability access, restrict them by role, and audit actions that manage alerts or dashboards. The separate Noz assistant is Cloud-only according to the README.
Metric exemplars were still dropped in v0.136.1
Open issue 12433 says SigNoz v0.136.1 did not store OpenTelemetry metric exemplars, even when its collector produced them. The report traces the gap to exporter inserts and metric tables that lack trace and span ID fields. Without those pointers, a user cannot click a metric sample and land on its exact trace. Filtering traces by time and attributes can find candidates, but the issue explains why that is not equivalent on a busy service.
This limitation matters if metric-to-trace navigation is part of the buying decision. Reproduce the issue on the version you plan to deploy and watch its status instead of assuming OpenTelemetry input means every OpenTelemetry field survives storage. The current product still correlates several signal types through shared context, but exemplars are a specific path with a specific open report. A trial should include the exact transitions your responders use, including a cost or latency spike tied to one request.
September 2026 releases are active, and licensing is split
GitHub recorded the last push on September 5, 2026, three days after v0.140.0 was published. The repository had 32,016 stars and 1,538 combined open issues and pull requests when fetched, with issues and PRs updated on September 4 and 5. Release v0.140.0 added Kubernetes container views, system dashboards, a Prometheus query API, AI-observability work, and fixes for alerts and queries. That pace supports continued evaluation, while the combined open count signals a large triage surface.
Licensing needs a directory-level read. The root license puts code outside ee/ and cmd/enterprise/ under MIT Expat terms, while those enterprise directories carry separate production restrictions. GitHub therefore reports no single SPDX license for the repository. SigNoz is a strong candidate for teams that want one OpenTelemetry system and have the staff to operate it. The 206 passing tests justify a trial; they do not choose the edition, retention plan, access policy, or storage budget for you.