Grafana queries many systems without becoming their storage engine
Grafana sits above data sources. A dashboard can combine queries from metrics systems, log stores, trace backends, Elasticsearch, InfluxDB, PostgreSQL, and many other plugins. Template variables make one dashboard reusable across services or environments, while Explore gives operators a less structured place to investigate. This separation is its main strength: teams can change the viewing and alerting layer without moving every signal into a new database.
The boundary also prevents a common misunderstanding. Grafana does not collect and retain every signal by itself. A production design still needs sources with their own ingestion, storage, retention, access rules, and capacity plans. Version 13.2.0 can improve dashboards and alerting, but it cannot repair missing labels in Prometheus or an undersized log cluster. Buyers should diagram the full path from instrumentation to storage to Grafana before calling it an observability stack.
The 209.9 MB checkout is a platform codebase, not a small dashboard app
At commit 3158269, our checkout contained 22,639 files, about 3,007,887 lines of source, and 209.9 MB before dependencies. It is a TypeScript-led monorepo with substantial Go backend code, plugin interfaces, alerting, authentication, data-source integrations, and a large frontend. The 94 CI workflow files show how many specialized checks maintainers use around that surface.
This scale matters most to contributors and companies carrying patches. A change to a panel can cross shared UI packages, query models, backend APIs, and end-to-end behavior. GitHub listed 3,344 combined issues and pull requests, which is not a defect count, but it confirms a large coordination surface. Deploying a packaged release is a very different commitment from maintaining an internal Grafana fork.
What happened when we ran it
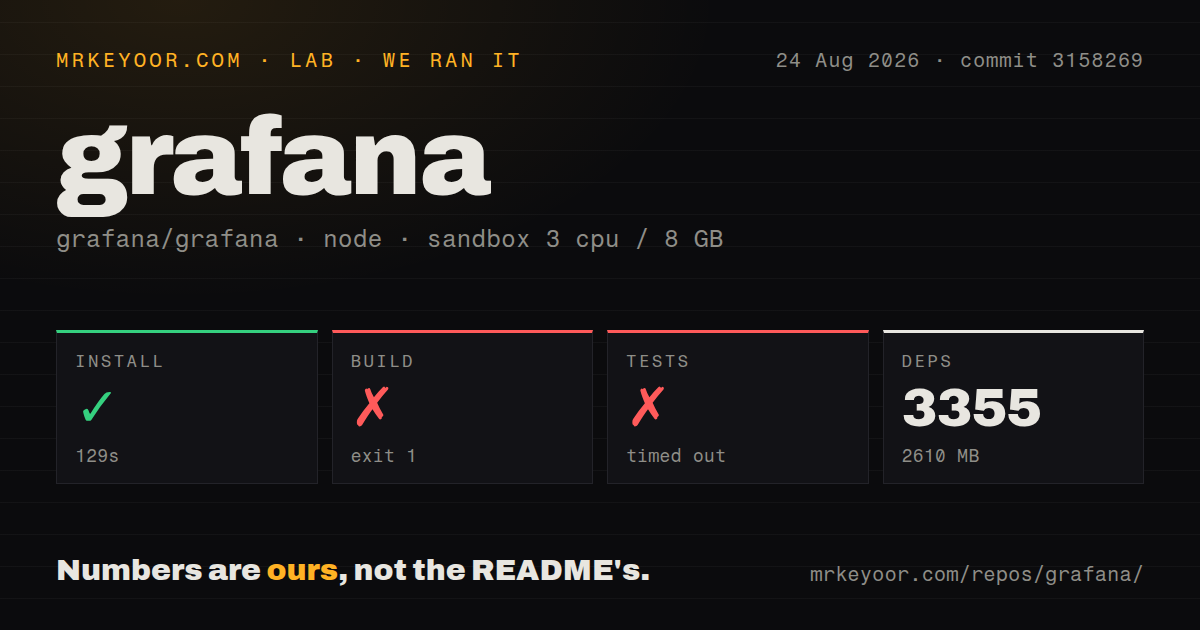
Our sandbox installed 3,355 Yarn packages in 129 seconds and occupied 2,610 MB on disk. The build ran for 166 seconds and failed with exit code 1. Its final lines only showed an Nx command-execution stack, status: 1, and null output fields. Because the tail contained no compiler or application error, we cannot name a cause from this log.
The test command reached our 900-second timeout. Near the end, Jest reported duplicate manual mocks named fixtures at public/app/features/correlations/__mocks__/fixtures.ts and public/app/core/components/AppChrome/MegaMenu/__mocks__/fixtures.ts. It then said no tests were found related to files changed since the last commit. The log does not tell us what occupied the full 900 seconds, so the defensible result is a timeout, not a passing or failing test count.
Our scan found monorepo workspaces, a Dockerfile, and no tests directory at the measured root. The absence of one root folder does not mean Grafana lacks tests; the log itself reached Jest files nested under application paths. These results describe a generic run in a 3-CPU, 8 GB, unprivileged lab-node:22 container. Grafana's contributor guide and CI targets are the next stop for a working source environment.
Packaged Grafana avoids the failed 166-second source build
The README sends users to Grafana's installation guides rather than presenting source compilation as the normal route. That is sensible. Official packages, containers, and the hosted service let an operator evaluate dashboards without installing 3,355 JavaScript packages or learning the repository's Nx task selection. Start with a supported distribution, pin version 13.2.0 or another chosen release, and build from source only when code changes justify it.
A useful deployment still requires configuration. Data-source credentials can expose production databases and telemetry. Alerting adds contact points, policies, silences, and notification templates. Teams also need authentication, authorization, TLS, a persistent Grafana database, dashboard backup or provisioning, and plugin controls. High availability changes session and database assumptions. None of those duties appeared in our dependency install, yet they decide whether the service remains trustworthy during an incident.
Version 13.2.0 mixes security work with broad feature change
Grafana 13.2.0 was published on August 18, 2026. Its notes name CVE-2026-17183 and list changes across alerting, dashboards, data sources, plugins, provisioning, accessibility, and backend code. The release also deprecates scripted dashboards and disables them by default. An upgrade therefore needs a security reading plus a compatibility check for dashboards, plugins, and automation that depend on older behavior.
The repository was pushed on August 27, 2026, and recent pull requests were arriving minutes apart when fetched. With 76,442 stars and current issue activity, maintenance is plainly active. Speed is not the same as predictability. Operators should use a staging instance, export or provision important dashboards, verify alert delivery, and test third-party plugins against the target release before moving the production endpoint.
AGPL terms and plugin trust belong in the purchase decision
Grafana is licensed AGPL-3.0-only, with a separate licensing document describing Apache-2.0 exceptions. Organizations that modify the server or provide it across a network should review those terms with counsel. Grafana Labs also sells hosted and enterprise products, so the practical choice includes community self-hosting, a commercial deployment, and cloud service rather than a single binary decision.
Plugins widen data-source and visualization support, but they also add code, update schedules, permissions, and compatibility risk. Treat each external plugin as a dependency: verify its publisher, signature status, release activity, and required access. Grafana is the default recommendation when many existing sources need a common operational view. SigNoz fits teams standardizing on OpenTelemetry, while Metabase is the clearer tool when the audience asks business questions of warehouse tables.