mrkeyoor.com_
Tue 01 Sept 17:43 UTC
Dataevaluationupdated 26 Aug 2026

openobserve review

OpenObserve is a self-hosted system for collecting and searching logs, metrics, traces, browser monitoring data, and LLM telemetry. It stores analytical data in Parquet on object storage and puts search, dashboards, alerts, and ingest pipelines in one interface.

+109stars / 7d
Verdict

Our OpenObserve build exceeded 900 seconds, while all 304 cargo tests passed in 195 seconds, so the code looks testable but expensive to compile on a 3-CPU box. Trial it when consolidating observability could remove several services and object storage already fits your operations. Do not adopt it without replaying production-shaped ingest, permission, retention, and recovery tests.

We ran it

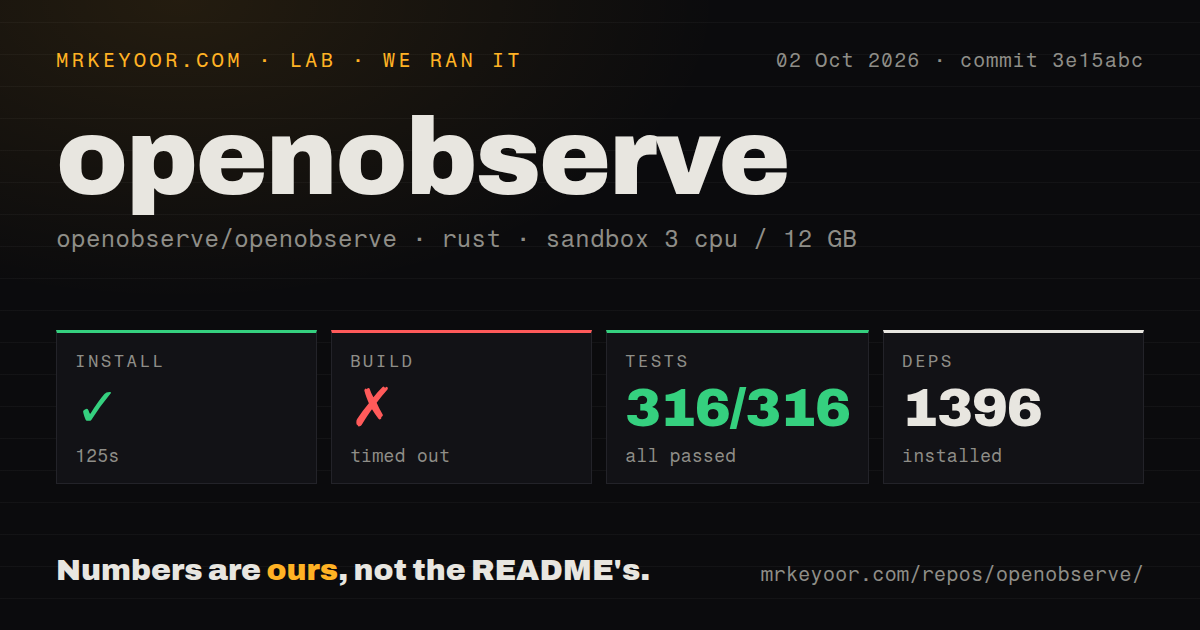
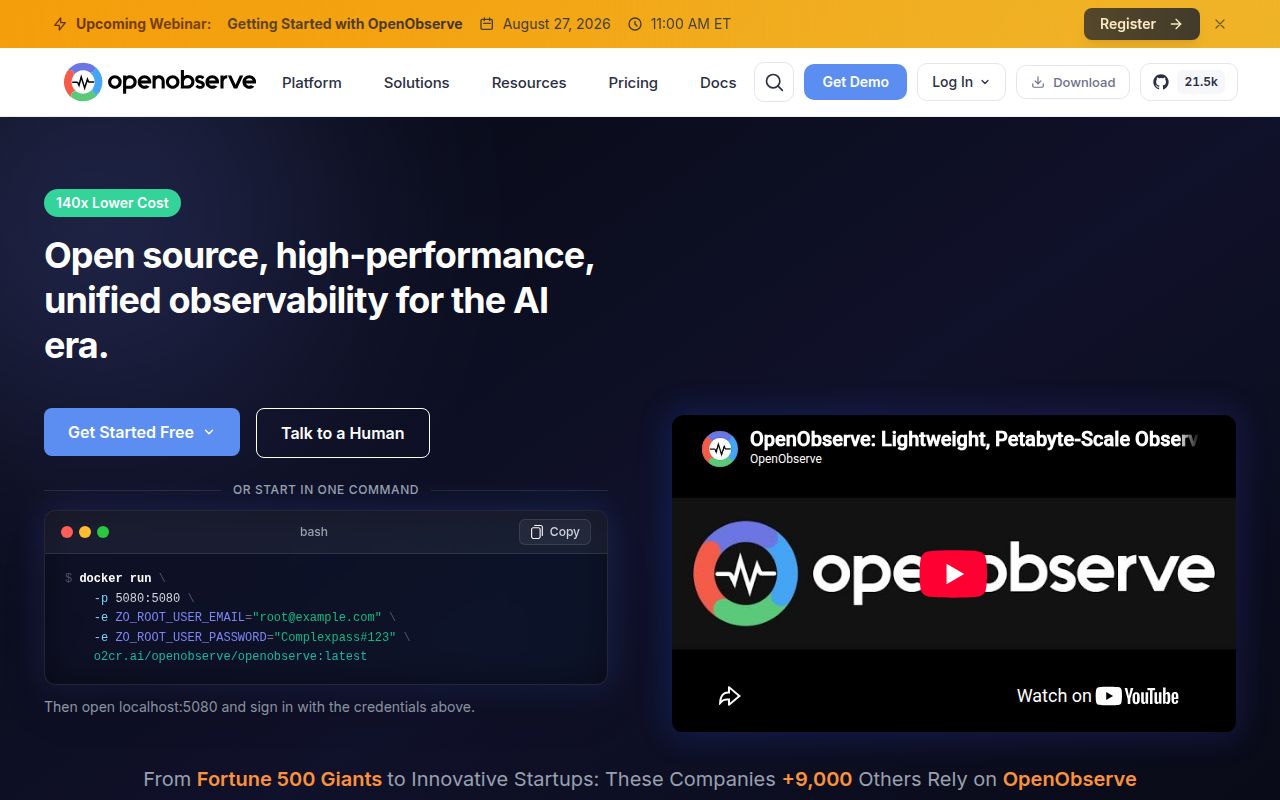
Lab card: what happened when we ran openobserveScreenshot of openobserve (openobserve.ai)
Install✓ · 254s1374 packages
Build✗ timed out · 900s
Tests✓ · 195s304 passed · 0 failed of 304 (cargo test)
Repo6731 files~2,209,547 lines of source · 202.8 MB · 46 CI workflows · tests dir

Answers from our run

Does openobserve build from source?

Dependencies installed in 254 seconds (1374 packages), and the build failed. We cloned commit b09b56e into a clean Debian container with 3 CPUs and no project-specific setup.

Do openobserve's tests pass?

Yes: 304 of 304 passed when we ran the project's own test command (cargo test). Some failures need services or credentials a bare container does not have.

Who should not use openobserve?

Organizations that cannot use AGPL-3.0 for a network service and do not want a commercial agreement.

What are the alternatives to openobserve?

SigNoz, Grafana Loki, Elasticsearch. Our OpenObserve build exceeded 900 seconds, while all 304 cargo tests passed in 195 seconds, so the code looks testable but expensive to compile on a 3-CPU box.

Setup3/5Container trial is short; source build exceeded 900 seconds
Docs4/5Wide feature and deployment coverage, with heavy product claims
Community5/521,482 stars with active August pushes and issue responses
Maturity4/5Broad telemetry scope, passing tests, and current release work

Discussed on

  1. hnShow HN: OpenObserve – Elasticsearch/Datadog alternative198 points
  2. hnOpenObserve: Observability platform for logs, metrics, traces, analytics85 points
  3. hnOpen source Elasticsearch alternative in Rust for logs. 140x lower storage cost19 points
  4. hnOpenObserve Raises $10M Series A9 points
  5. hnOpenObserve: Elasticsearch/Splunk/Datadog alternative for logs, metrics, traces7 points

Who it’s for

Platform teams that want logs, metrics, and traces in one self-hosted product.
Organizations already comfortable operating S3-compatible storage and OpenTelemetry collectors.
Teams willing to test their own ingestion volume, query patterns, and retention policy before migration.
Operators who prefer SQL and PromQL over a vendor-specific query language.

Who it’s NOT for

Organizations that cannot use AGPL-3.0 for a network service and do not want a commercial agreement.
Self-hosters who require SSO, advanced RBAC, or audit trails in the free edition: the README places those controls in Enterprise.
Teams needing a quick source build in a small CI window: our build was still running when the 900-second limit ended.
Operators who cannot stage load and loss tests: open issue 13869 reports large silent ingestion loss on an S3 or MinIO setup under load.
Buyers who want a fully verified single-node-to-cluster path from this review: our run compiled and tested source but did not ingest telemetry or operate object storage.

Setup reality

Our Rust sandbox installed 1,374 packages in 254 seconds. The build did not finish before the 900-second cap. Cargo tests completed in 195 seconds with 304 passed and 0 failed, so the checked-out code tested cleanly even though a full build exceeded our window.

The Docker trial needs a persistent data mount plus root email and password variables. Production commonly adds S3-compatible object storage, OpenTelemetry collectors, retention rules, TLS, backups, and several roles for high availability. SSO and advanced access controls are Enterprise features.

The checkout contained 6,731 files, about 2,209,547 source lines, and 202.8 MB. There was no Dockerfile at the checked-out root, although the README provides a published container command. Our run did not measure ingestion speed, query speed, storage savings, or failure recovery.

OpenObserve puts five telemetry jobs behind one interface

OpenObserve collects logs, metrics, traces, browser monitoring data, and telemetry from LLM applications. The same product provides search, dashboards, alerts, incident handling, and ingest pipelines. That consolidation is attractive when a team is operating separate logging, metrics, tracing, and frontend tools and spending more time joining them than investigating incidents.

The architecture uses Parquet files and S3-compatible object storage for analytical data. A single-binary mode covers smaller deployments, while the documentation points larger installations toward a clustered high-availability design. OpenTelemetry is the intended ingestion standard. SQL is used for logs and traces, while metrics can be queried with SQL or PromQL. Those choices are familiar enough to make a trial realistic.

AGPL code and Enterprise access controls create a licensing decision

The repository is licensed under AGPL-3.0. Organizations offering a modified network service should have counsel or an open-source program review the obligations before deployment. The project also sells an Enterprise edition. The README assigns SSO, advanced role-based permissions, audit trails, federated search, sensitive-data redaction, and some encryption and workload controls to that edition.

This split matters for internal observability because telemetry can contain customer identifiers, request payloads, database statements, and secrets accidentally written to logs. A free single-admin trial proves the search experience, but it does not prove that the available permission model meets production policy. List required roles, tenant boundaries, audit evidence, and redaction rules before comparing costs or planning migration.

What happened when we ran it

Our sandbox cloned commit b09b56e and installed the Rust dependency set in 254 seconds. Cargo resolved 1,374 packages. The checkout contained 6,731 files, roughly 2,209,547 source lines, and 202.8 MB of repository data. This is a substantial source tree before compiler artifacts and telemetry storage enter the picture.

The build remained unfinished when our 900-second limit expired. The log outcome is a timeout, not a compiler failure and not a successful build. A team compiling from source should budget a longer job or stronger builder than our 3-CPU, 12 GB container. We did not extend the limit, so we cannot state how much more time the build needed.

Cargo tests completed in 195 seconds. Our run recorded 304 passed and 0 failed out of 304. That result is useful because it covers actual test execution on the same commit that exceeded the build window. It does not measure the web interface, an OpenTelemetry ingest path, object storage, clustered behavior, query latency, or retention cleanup under production data.

A Docker trial is smaller than an observability migration

The README's Docker command needs a persistent data directory, port 5080, and root email and password variables. That is enough to open the UI and send initial events. A production setup needs TLS, an identity and permission plan, storage lifecycle rules, backups, capacity limits, and collector configuration. A high-availability deployment also introduces multiple service roles and coordination around object storage.

Migration should begin with duplicated telemetry rather than a hard cutover. Send a limited set of services to OpenObserve and the incumbent system, then compare event counts, timestamps, field parsing, alert results, and trace relationships. Keep representative queries and dashboards as acceptance fixtures. Observability software has to report failures during its own storage or network trouble, so degraded-path tests matter as much as the happy dashboard.

An open ingestion-loss report deserves a direct reproduction

Open issue 13869 reports that a self-hosted deployment using an S3 or MinIO backend silently lost roughly 75 to 82 percent of records under a described load, while responses did not mark partial ingestion. This is one reporter's current result, not a finding from our sandbox. It is serious enough that a team with similar storage and ingestion patterns should reproduce the case before adoption.

Other current reports show the range of operating details. Issue 13780 concerns local compactor cache behavior and cgroup file memory growth. Issue 13965 describes result-cache indexing and garbage collection. Release v0.92.2, published August 17, 2026, adds a compactor delay setting and fixes MCP calls behind a configured base URI. Active fixes are good; they also show that storage cleanup and routing configuration need monitoring.

August activity is strong, while the claims still need local proof

GitHub recorded 21,482 stars, 571 combined issues and pull requests, and a last push on August 26, 2026. The latest release arrived 9 days earlier. That is current maintenance and issue traffic, not evidence that every deployment mode is equally proven. The README makes large claims about storage cost, scale, and speed that our lab did not benchmark.

OpenObserve deserves a trial for teams trying to collapse a fragmented observability stack. Its 304 passing tests, current releases, and broad ingest surface support that decision. The 900-second build timeout, AGPL terms, Enterprise-only access controls, and open ingestion report argue for a measured pilot with mirrored traffic. Buy or migrate only after the counts and failure behavior match your own workload.

Alternatives

ProjectWhat it isPick it when
SigNozAn OpenTelemetry observability platform covering traces, metrics, logs, dashboards, and alerts.pick this instead when an OpenTelemetry-first application-performance workflow matters more than OpenObserve's object-storage design.
Grafana Loki gh↗A log aggregation system designed to pair with Grafana and the wider Grafana telemetry stack.pick this instead when Grafana is already the operating center and logs can remain a separate service.
Elasticsearch gh↗A distributed search and analytics engine with a large ecosystem for logging and search workloads.pick this instead when existing Elastic expertise, integrations, and search behavior outweigh a simpler consolidated product.

What people are saying

  1. [velocity-scout] openobserve/openobserve

Sources

  1. OpenObserve repository and README
  2. OpenObserve v0.92.2 release
  3. Self-hosted ingestion loss report 13869
  4. Compactor cache report 13780
  5. Result cache report 13965

More data reviews

turso · TrackersListCollection · dash · getcontact-cli · awesome-zhuiju-free · iggy · the whole board →