v0.9.29-alpha is a Windows debugger with an early Linux path
RAD Debugger is built for native, local x64 debugging. Windows gets the established path with PDB input, while the September 30 v0.9.29-alpha release introduced preliminary Linux debugging with DWARF conversion. The interface covers source and disassembly views, breakpoints, expression evaluation, memory inspection, threads, modules, and crash dumps. Its strongest pitch is narrower than "another GDB front end": the project owns the graphical debugger, the debug-information conversion layer, and much of the supporting native toolchain.
The repository also contains RAD Linker and the radbin utility. RAD Linker emits x64 PE/COFF binaries and standard PDB files, with optional native RDI output. radbin converts debug information and prints textual dumps. Those pieces matter most on very large Windows builds where link and debug-data handling are part of the same wait. They also make the codebase useful to toolchain engineers who may never adopt the graphical debugger as their daily UI.
PDB and DWARF files are inputs rather than the debugger's working format. RAD converts them into RDI on demand, then loads and searches that data through its own asynchronous layers. The repository exposes lib_rdi as a standalone C library and provides construction helpers in lib_rdi_make. That design is relevant if your existing PDB workflow is the bottleneck. It also means format conversion is part of the debugger path you should test with your compiler's output.
What happened when we ran it
Our sandbox did not run commit 98467d0 on October 7, 2026. The harness had 3 CPUs and 8 GB of RAM, but it has no supported C ecosystem, and this repository has no Dockerfile. Our test method therefore produced no install, build, test, dependency, vulnerability, or timing result. A green upstream release and a green lab run are different evidence, and this page has only the former. This is a coverage boundary, not evidence that the source succeeds or fails.
That gap should affect your trial plan. We cannot tell you that the build script works in a clean Debian container, that the supplied tester passes, or that the checkout has a clean dependency audit. We can only report that we did not run it and why. If you need reproducible CI evidence before adopting a debugger, build commit 98467d0 on the same Windows or Linux image your team ships and record the compiler, SDK, libraries, and test command.
Windows needs an SDK; Linux needs 7 graphics libraries
The project README gives Windows and Linux build paths. Windows requires MSVC 2017 or later and the Windows SDK, though Clang can compile when that SDK is installed. From a configured native-tools prompt, build.bat produces the debugger, while arguments select release mode, RAD Linker, or radbin. Prebuilt Windows binaries are also attached to releases, which is the shortest route to an evaluation.
Linux requires GCC or Clang plus development packages for FreeType, X11, Xext, Xfixes, Xrandr, OpenGL, and EGL. The build script produces a local raddbg binary, but v0.9.29-alpha does not publish Linux binaries. The release notes list unsupported fork and vfork debugging, libc assumptions in thread-local storage lookup, incomplete unwinding without .eh_frame_hdr, incorrect bitfield handling, and some DWARF-to-RDI type deduplication failures. That is a candid list, and a serious operating limit.
The Linux alpha has specific breakpoints and crashes
The first week of Linux availability generated actionable reports. Issue 970 says a conditional breakpoint fired regardless of its expression. Issue 996 reports that debugging the Factorio demo froze and consumed 56 GB before the process was killed. These are reporter observations, not failures from our sandbox, but both touch core debugger behavior rather than cosmetic polish.
Windows is not free of alpha risk. Issue 989 reports changed program behavior while stepping after moving from v0.9.21 to v0.9.29. One report cannot establish a general regression, yet debugger interference is exactly the class of failure that demands a small representative trial. Keep your existing debugger installed, reproduce known bugs under both tools, and compare memory plus stepping before switching a team.
Usage documentation is separate, and one promised copy is missing
The top-level README explicitly says it is a technical overview, not a usage manual. It points readers to documentation packaged with releases or placed in the build folder after compilation. Issue 999, opened October 7, says an Arch Linux build did not contain that promised file. The source documentation is unusually detailed about architecture and build inputs, but a new user may still have to fetch a release to learn the interface.
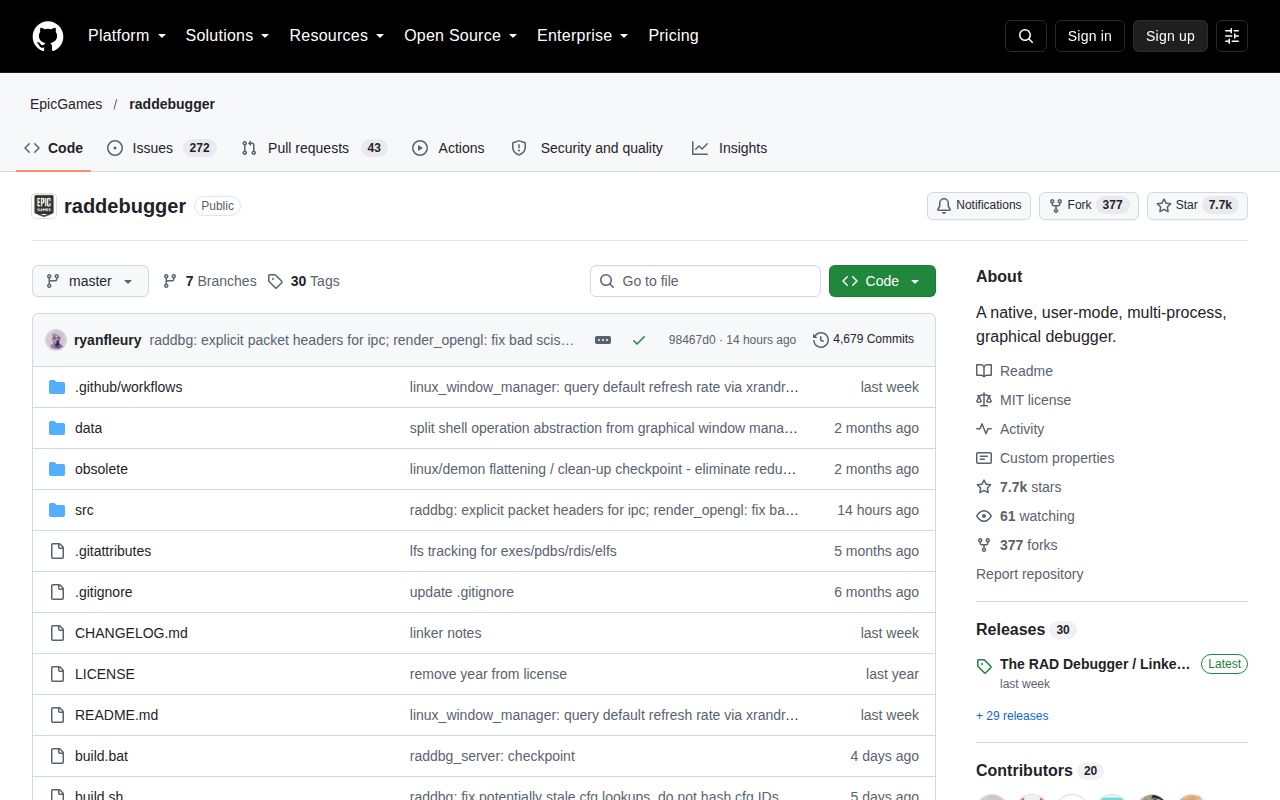
Project health is easier to judge. GitHub showed 7,739 stars, 315 combined issues and pull requests, and a push on October 7, 2026. The latest release was only 7 days old, and new bug reports were receiving updates. RAD Debugger is plainly active. Its alpha label still means what it says: use it beside an existing debugger first, especially on Linux, and keep a known-good path available when the program under inspection behaves differently.