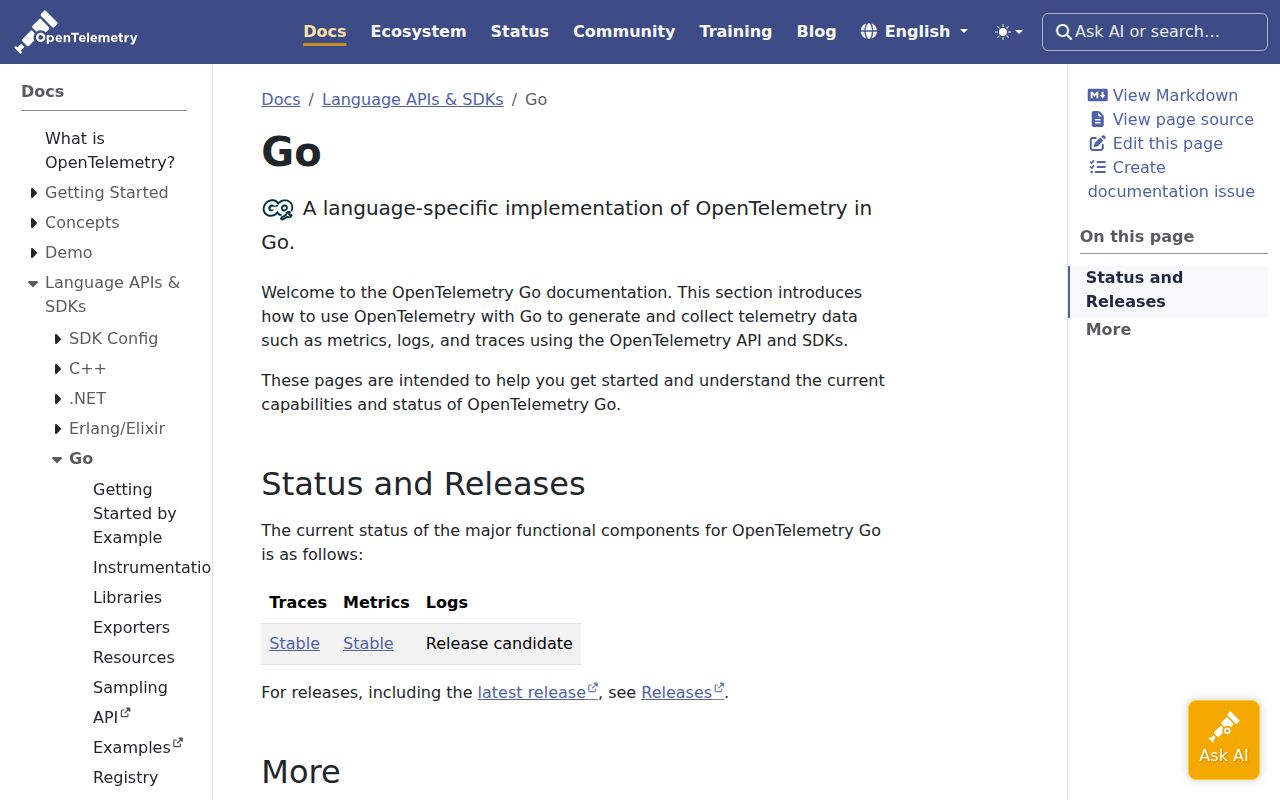
All 3 telemetry signals are stable
OpenTelemetry Go gives Go applications common APIs for traces, metrics, and logs. The SDK records those signals and exporters send them elsewhere. OTLP covers all three, Prometheus exports metrics, stdout handles all three for inspection, and Zipkin handles traces. That split lets application code describe work once while the deployment decides whether data goes to a collector, a local console, or a vendor endpoint.
The October 2 release matters because v1.47.0 is the first stable release of the Logs API and SDK. Traces and metrics were already marked stable, so the README now lists stable status for all 3 signals. This is the point at which a Go team can adopt the main signals under stated compatibility guarantees instead of mixing stable trace and metric APIs with a pre-1.0 logging layer.
Instrumentation lives in a second repository
The core package is lower level than many first-time users expect. It contains APIs, SDKs, propagators, and exporters. Instrumentation for HTTP routers, gRPC, database clients, and other libraries lives in open-telemetry/opentelemetry-go-contrib. The README sends readers there and to a separate examples directory. Installing only this repository leaves you writing spans and meters directly unless your dependencies already emit OpenTelemetry data.
That separation is sensible for maintainers, though it adds version work for adopters. The policy says stable contrib modules follow the core project's stable version, with releases staggered after core. Experimental modules remain at v0 and may make incompatible changes in a minor release. Read the module path and version for every integration you import. A repository release can contain v1.47.0, v0.69.0, v0.23.0, and v0.1.0 packages at once.
What happened when we ran it
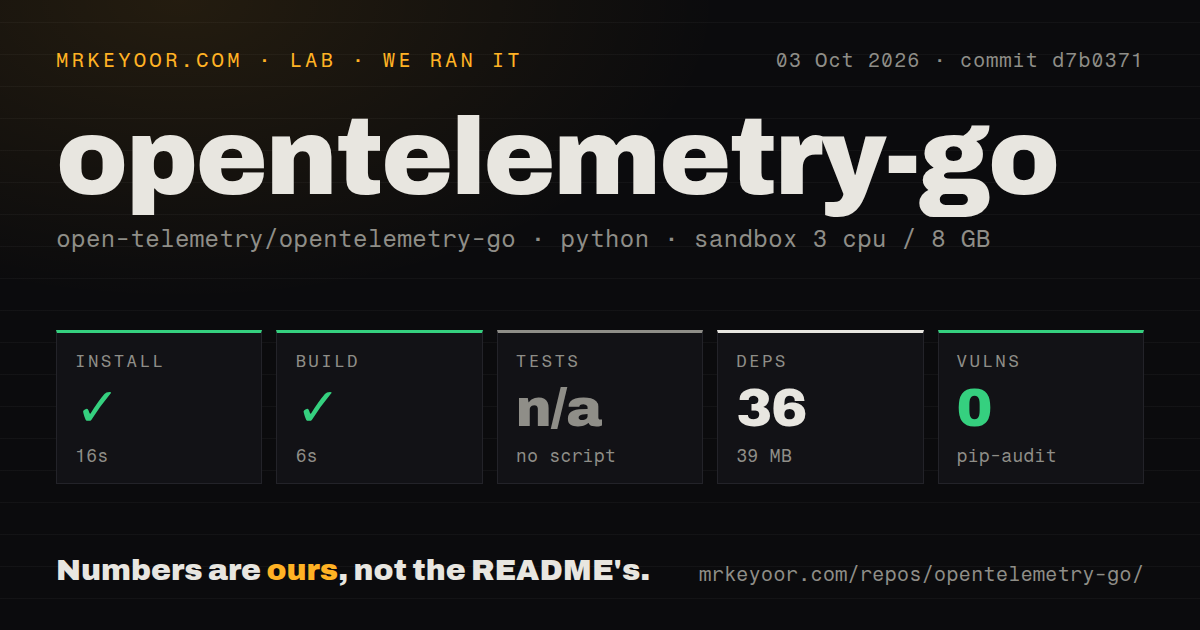
Our sandbox installed commit d7b0371 in 16 seconds. The harness added 36 packages, used 39 MB on disk, and completed its build step in 6 seconds. Pip-audit reported 0 known vulnerabilities. The checkout had 1,629 files, roughly 962,218 lines of source, and occupied 33.5 MB in a fresh unprivileged container with 3 CPUs and 8 GB of RAM.
There is an important mismatch in that result. The supplied lab harness classified the checkout as Python and ran inside an uv image with Python 3.12. OpenTelemetry Go is a Go repository, and its current go.mod declares Go 1.26. The harness found no test script or target, so it skipped tests. We will not turn that absence into a claim about the project's native Go tests.
The measured install and build succeeded, but they do not replace go test across the modules your application imports. Our scan counted 14 CI workflow files and found no root Dockerfile or tests directory. Those layout signals do not prove that tests are missing. For an adoption decision, repeat the native Go commands at the pinned module versions and exercise the exporter against your chosen collector.
Go 1.26 and 1.27 define the supported window
The README's compatibility table names Go 1.26 and 1.27 on Ubuntu, macOS, and Windows. It covers amd64 and arm64 on all 3 systems, plus 386 on Ubuntu and Windows. Other systems may work, but the project makes no compatibility guarantee for them. A team on an older Go toolchain has to upgrade or select an older OpenTelemetry release with a matching support window.
OpenTelemetry follows Go's policy of supporting a release until two newer major versions exist. The project adds support for a new Go version in one minor release, then may use the next minor release to stop testing the oldest archived version. That cadence is predictable, but it can move faster than conservative enterprise toolchains. Put Go upgrades beside telemetry module upgrades in the same maintenance plan.
Exporters still need endpoint and failure decisions
Instrumentation does not produce a useful operations system by itself. An application must configure an exporter, endpoint, transport, sampling policy, resource attributes, and shutdown behavior. A hosted destination may also require credentials. Sending OTLP directly from every process is possible, while a collector can buffer, route, and transform data outside the application. The right choice depends on how you handle backpressure and outages.
Open issue 2579 shows a smaller packaging cost: the OTLP HTTP trace modules import gRPC through shared configuration. The report was opened in 2022 and was still active on October 1, 2026. If a strict module graph is part of the reason you picked HTTP, inspect go mod graph before accepting the dependency. Open issue 9055 also documents that disabling gRPC exporter compression through code reported an error in v1.46.0, even though it produced no compression.
v1.47.0 fixes production-shaped failures
Release v1.47.0 fixed a data race in the periodic metric reader, precision loss for large int64 metric values, a trace error-recording deadlock, and a nil-exporter shutdown panic. It also set a default maximum depth of 64 for composite attribute values. These are specific failure modes in concurrent services, and their presence in one release shows why telemetry libraries deserve the same upgrade discipline as networking code.
GitHub showed 6,572 stars and 160 combined open issues and pull requests on October 4, 2026. The last push was October 3, one day after v1.47.0. That pace and the detailed versioning policy point to an actively maintained project. The decision is still narrow: use the core SDK when vendor-neutral telemetry across 3 signals is worth coordinating core, contrib, exporter, collector, and Go versions.