Instrumentation is stable, while the query client is alpha
client_golang v1.24.1 contains two products with different promises. The prometheus packages instrument Go code and expose metrics, while api/prometheus talks to a Prometheus server. The README says the API client is alpha and experimental. Breaking changes there do not force a new major version, even though the repository generally follows semantic versioning elsewhere.
For instrumentation, the familiar pieces are all present: counters, gauges, summaries, histograms, label vectors, registries, and custom collectors. promhttp serves gathered metrics over HTTP, promauto registers metrics for simpler programs, and testutil helps compare collected output. The package docs say exported functions and methods are concurrency safe unless a specific API says otherwise.
A custom registry avoids hidden global collectors
The default registry starts with Go runtime and process collectors already registered. That is convenient for a small service, but shared global state can surprise tests and libraries that register the same metric twice. prometheus.NewRegistry() lets an application decide which collectors exist, pass the registry into its own metrics constructor, and expose that exact set through promhttp.HandlerFor.
Labels deserve more design work than the installation does. Each distinct label set becomes another time series, so values such as user IDs, request IDs, or unbounded URLs can create a costly metric set. client_golang checks descriptor and label consistency, but it cannot decide whether a label belongs in your monitoring model. Define the questions and aggregation boundaries before scattering WithLabelValues calls through request paths.
What happened when we ran it
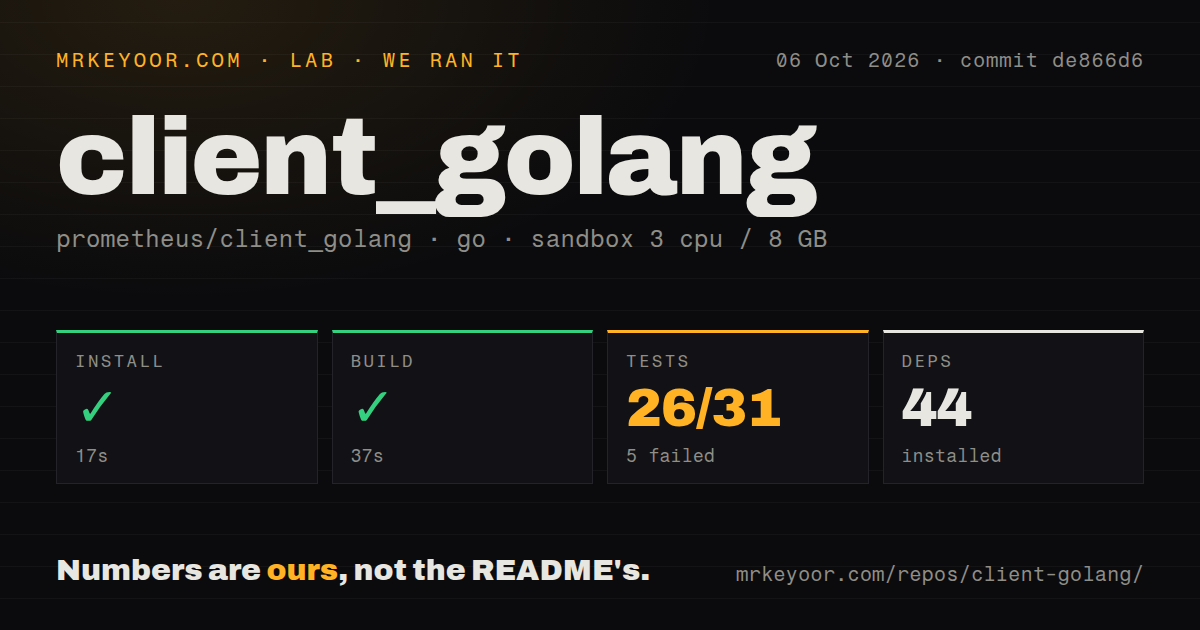
Our sandbox installed commit de866d6 in 17 seconds and added 44 packages. The checkout had 213 files, about 44,690 source lines, and occupied 2.6 MB. We ran it in an unprivileged Debian container with 3 CPUs, 8 GB of RAM, no secrets, and the golang:1.24-bookworm image. Installation and the 37-second build both succeeded.
The test step failed after 32 seconds. The supplied Go test summary counted 26 passed and 5 failed out of 31. Its final lines show github.com/prometheus/client_golang/prometheus/collectors failing while packages including promhttp, push, testutil, and graphite passed. The tail does not include the failing assertion or error, so it cannot support a diagnosis.
Our scan found 9 CI workflow files, no Dockerfile, and no conventional tests directory. Go projects commonly keep *_test.go files beside source, so the absent directory is only a layout fact. More important is the red command: commit de866d6 built, yet it did not give our fresh container a clean complete suite.
v1.24.1 requires Go 1.25 or newer
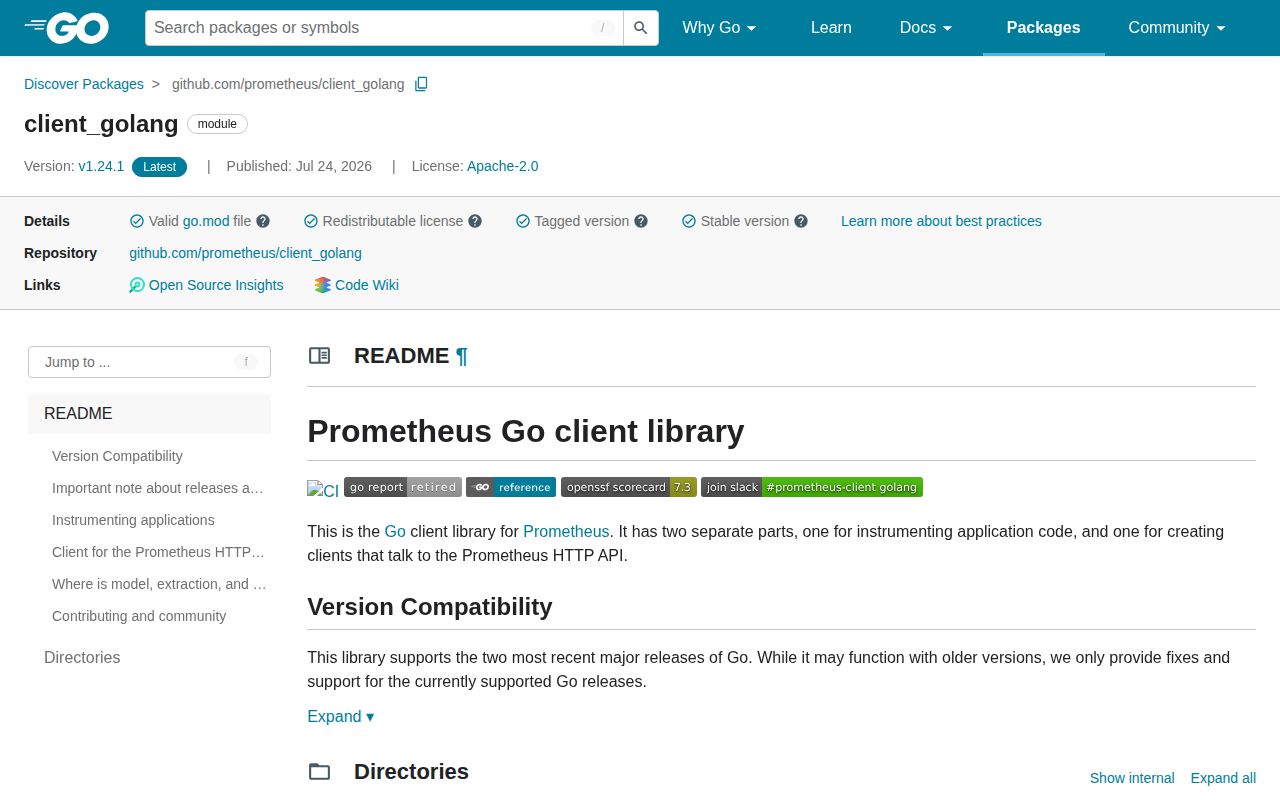
Release v1.24.0 raised the minimum Go version to 1.25 and limited supported runtimes to Go 1.25 and 1.26. The v1.24.1 patch, published July 24, fixed a promhttp panic when a request had a nil URL. The main branch has since changed go.mod to 1.26, and its unreleased changelog records that move.
Our image was labeled Go 1.24, yet the build passed. That result does not override the project’s support policy or reveal which toolchain behavior made the command succeed. Production users should pin both the module and Go versions, then run application tests against the pair. Older toolchains may appear to work while receiving no fixes from maintainers.
Pull remains the default, and OTLP uses a bridge
The README recommends pull-based collection through promhttp for discovery, failover, and reliability. A typical service exposes /metrics, and Prometheus decides when to scrape it. The repository also includes a Pushgateway client and a Graphite bridge, but those are separate choices around the same gathered metrics.
OTLP push does not require rewriting every metric call. The documented route wraps a Prometheus registry with the OpenTelemetry Prometheus bridge, then sends through an OTLP exporter to a collector or compatible backend. That bridge lives in opentelemetry-go-contrib, outside this module. Teams standardizing on OpenTelemetry should compare that adapter path with native OpenTelemetry instrumentation before committing.
October activity shows maintenance, with 146 open items
The repository was pushed on October 5, 2026, and GitHub showed 6,038 stars. On October 7, search counted 90 open issues and 56 open pull requests. Current work includes OpenMetrics 2.0 support, HTTP response instrumentation, API decoding, collector locking, and dependency changes. Release v1.24.1 is older than that activity, so the July tag alone does not describe project health.
An October report, issue 2147, describes a blocked metric write holding vector read locks; pull request 2157 proposes sending collected metrics after releasing that lock. Issue 2155 reports promhttp committing HTTP 200 before a wrapped copy produces data. These are open reports, not findings from our sandbox, but both concern request paths where metrics code can affect application behavior.
Use the metrics library and isolate the experimental client
At commit de866d6, our build passed in 37 seconds while 5 of 31 test targets failed. That is enough reason to test the exact module and Go pair in your own CI, especially around runtime collectors and HTTP middleware. It is not a reason to replace the standard Prometheus client without reproducing the failure on a supported toolchain.
The safer architecture is to keep instrumentation behind your own small package and pass an explicit registerer into it. That contains metric names, labels, and registration behavior while leaving client_golang replaceable. If you use the alpha query client, isolate that separately too, because its compatibility promise is materially weaker than the instrumentation API’s.