Six built-in series cover the financial chart basics
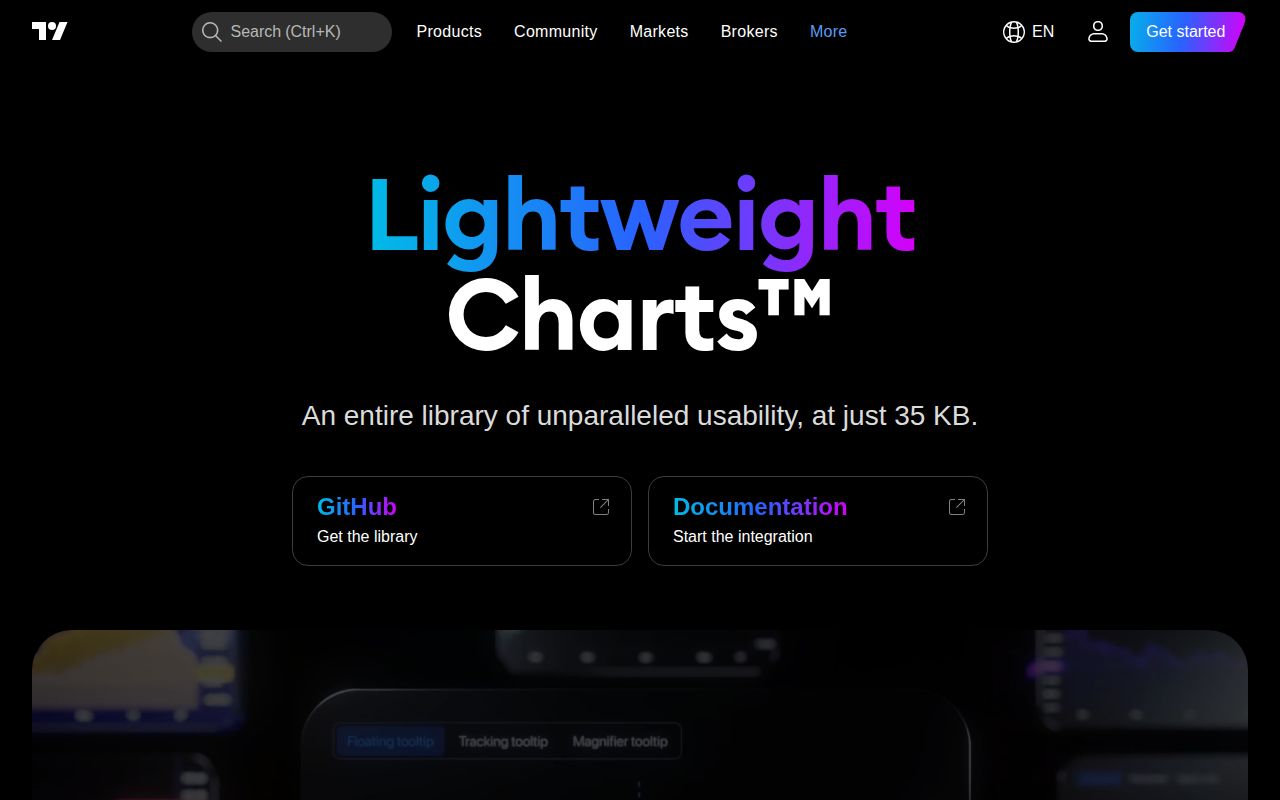
Lightweight Charts takes timestamped or business-day data and draws it in a browser canvas. The six core series are area, bar, baseline, candlestick, histogram, and line. A chart supplies time and price scales, scrolling, zooming, a crosshair, multiple panes, and APIs for replacing a dataset or appending the latest point. That is enough for price histories, portfolios, yield curves, option displays, and compact market widgets without adopting a complete trading interface.
The boundary is important. Lightweight Charts does not fetch quotes, normalize exchange calendars, calculate indicators, place orders, or persist drawings. Your application owns those jobs and calls setData for an initial series, then update for a changed last bar or a new one. The docs warn against repeatedly calling setData for updates because it replaces the entire series and can hurt performance. This library earns its name by staying on the drawing side of the line.
What happened when we ran it
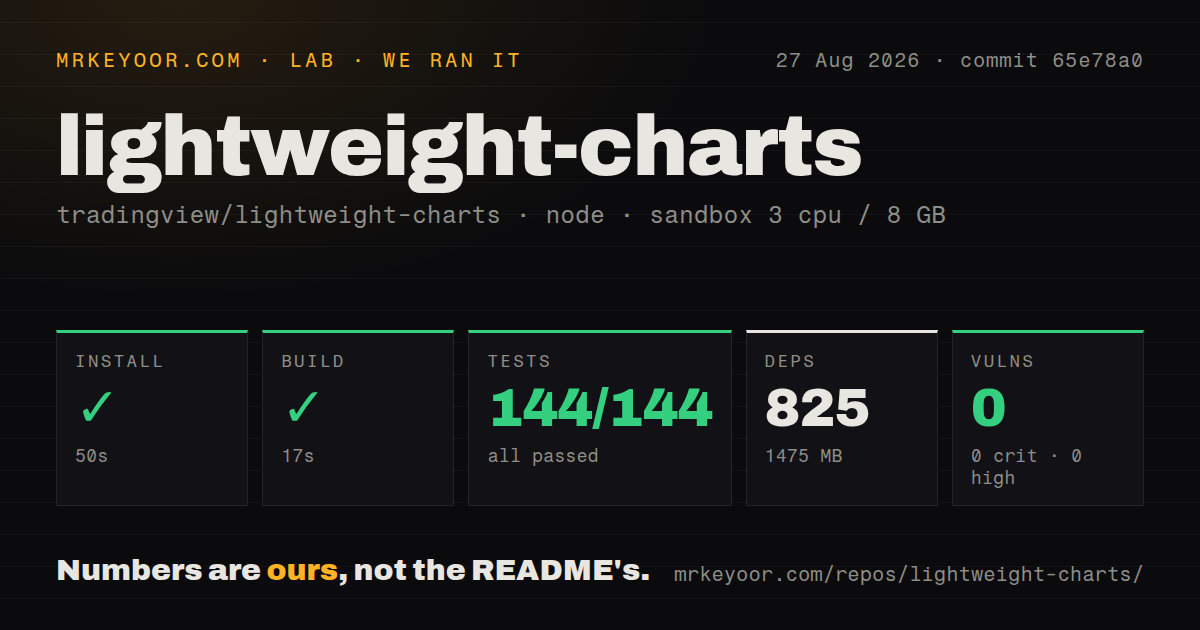
Our sandbox installed 825 npm packages in 50 seconds, leaving 1,475 MB on disk. The project built successfully in 17 seconds. We then ran its tests in 9 seconds: node:test reported 144 passed and 0 failed out of 144. Npm audit found 0 known vulnerabilities across the installed dependency tree, with 0 critical, high, moderate, or low findings.
We tested commit 65e78a0 in an unprivileged Node 22 container with 3 CPUs and 8 GB of RAM. The checkout held 1,534 files, about 100,725 lines of source, and 6.4 MB before installation. It has 4 CI workflows and a tests directory, but no Dockerfile, which fits a browser package rather than a service. The 1,475 MB development tree is heavy next to the small checkout, yet consumers bundle the library output, not the repository's compilers, docs, and test tools.
ES2020 browsers work, while server rendering does not
The first chart needs a container, createChart, one imported series type, and data. Npm supplies ES modules and TypeScript declarations; unpkg supplies standalone IIFE builds under window.LightweightCharts. Production and development variants are published both with and without bundled dependencies. No account or API key is needed. The browser must support ES2020, or the host build needs to transpile the package for older targets.
Server-side Node use is explicitly unsupported. A Next.js or similar application should load chart code on the client after a real DOM container exists. If the product needs PDFs, email images, or social cards generated without a browser, plan a capture layer or another renderer. Mobile wrappers do not change that architecture: iOS and Android place the chart inside a web view. Current iOS guidance requires iOS 15, Xcode 16, and Swift 6; Android starts at SDK 23 with an ES2020-capable WebView.
Version 5 trades old convenience methods for smaller bundles
The v5 API replaces calls such as addLineSeries with addSeries(LineSeries), requiring each series type to be imported. Markers moved into a separate primitive, and watermarks became pane plugins. Plugin interface names also changed. These edits improve tree shaking because applications no longer carry marker or watermark code they do not use, but upgrading an established v4 wrapper is source work rather than a package-number bump.
TradingView has a direct migration guide with before-and-after code for all 6 series types, markers, watermarks, and renamed plugin interfaces. The repository also ships an agent skill for v5 conventions that supports Claude Code and Codex. That may reduce stale generated snippets, though it should not replace the versioned API reference. The documentation itself caught and fixed examples that called priceScale() without the required scale ID, a reminder that copied examples still need tests in the consuming application.
Plugins are the route to indicators and drawing tools
Custom series can define their own data structure and canvas renderer while retaining the standard series API. Series primitives attach annotations or drawing behavior to one series and may render on the chart or its scales. Pane primitives cover chart-wide visuals such as watermarks, but the docs say they cannot draw on price or time scales. The repository includes interactive examples for heatmaps, alerts, tooltips, and accessibility.
This extension model is capable and low-level. A team asking for Fibonacci tools, order lines, custom indicators, or domain-specific annotations should inspect the plugin examples before estimating the work. Open issue 2087 still asks for a trade-management plugin example, which is a useful signal about where the finished library stops. Release v5.2.1 added a packaged accessibility helper, so keyboard navigation, ARIA markup, and screen-reader announcements now have a closer starting point than a blank primitive.
Attribution is mandatory even under Apache 2.0
The code uses Apache 2.0, but the README and getting-started guide require products to identify TradingView as the creator. A public website or mobile application must carry the NOTICE attribution and a link to TradingView. The chart has an attributionLogo option that can satisfy the link part. Legal review should treat this as a deployment requirement, especially for white-label dashboards where visible third-party credit may be unacceptable.
GitHub showed 17,090 stars, 126 combined issues and pull requests, and a last push on August 21, 2026. Release v5.2.1 arrived August 12 with hover performance work, marker fixes, an accessibility plugin, and the agent skill. The clean 144-test run and 0-vulnerability audit support a high maturity score. Lightweight Charts is the focused choice when canvas financial rendering is the problem. It is a poor substitute for the data, analytics, and workflow layers that surround a real trading product.