Komari watches many servers from one small dashboard
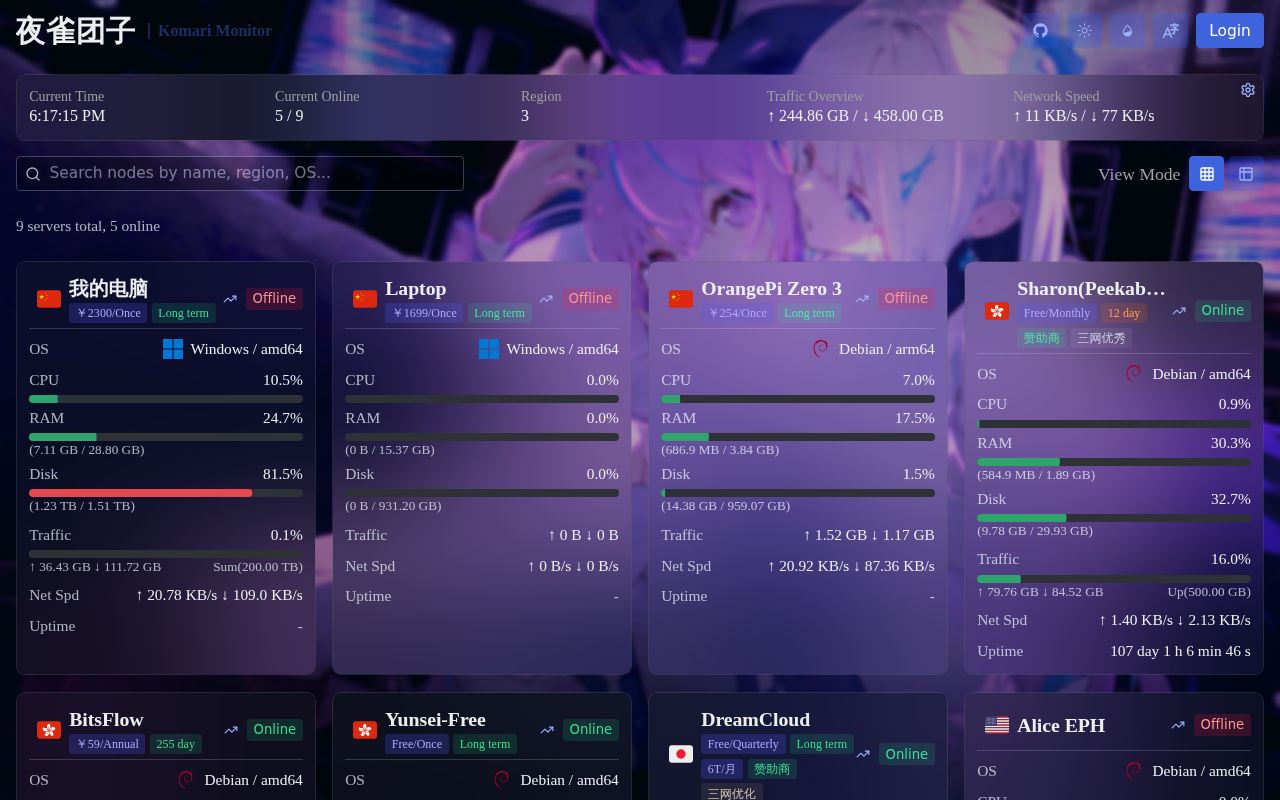
Komari pairs a central web application with agents on monitored machines. The agents send system measurements at one-second intervals, and the dashboard presents current status, historical charts, and administration screens. Screenshots also show a web terminal, theme controls, and a theme market. This is a better fit for a self-hoster watching a handful of servers than for an observability team building arbitrary queries across application traces and business events.
The project stays approachable by keeping the public pitch narrow. It is self-hosted, has a Docker route, publishes binaries, and supports plugins and custom themes. The default README is in English with a Simplified Chinese version beside it. Installation details live on the project's documentation site rather than in the repository overview, so an evaluator must leave the README to see the actual Docker, binary, source-build, and update procedures.
An 86-package install built cleanly before tests failed
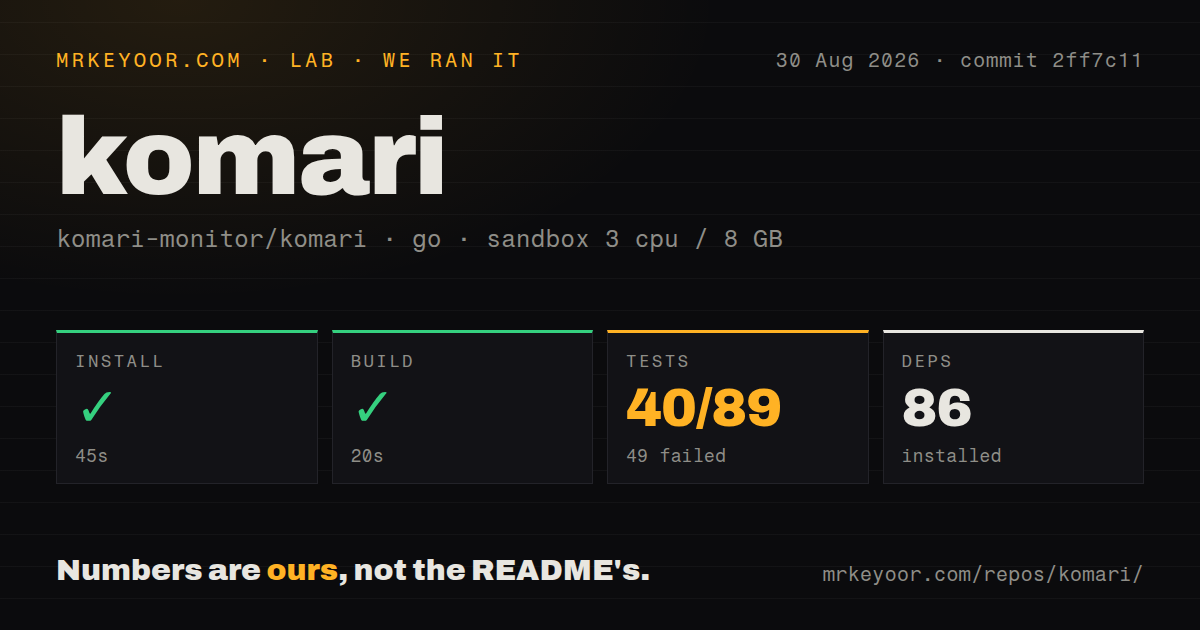
Our Debian sandbox installed 86 Go packages in 45 seconds. The checkout at commit 2ff7c11 was only 2.6 MB, containing 417 files and roughly 76,048 source lines. A 20-second build completed successfully under Go 1.24 with 3 CPUs and 8 GB of RAM. That is a modest source footprint for a dashboard, agent protocol, storage layer, plugin runtime, and control endpoints in one repository.
The clean build is only half the source story. Komari's test command discovered 89 packages and failed 49 of them. The repository has 10 CI workflow files and a Dockerfile, which makes both automation and a packaged deployment route visible. Our scan found no top-level tests directory, but Go tests can sit next to the packages they cover, as the 40 passing package results demonstrate.
What happened when we ran it
Our run installed dependencies in 45 seconds, built in 20 seconds, and spent 131 seconds on tests. Go reported 40 passing packages and 49 failed packages out of 89, then returned exit code 1. The final lines show successful results for metric, RPC, time, GeoIP, logging, outbound HTTP, agent, backup, connection, and security packages before the overall FAIL.
The supplied tail does not contain the first failing error or name every failed package. It would be inaccurate to blame missing services, unavailable ports, permissions, timing, or a code regression from that evidence alone. The measured finding is simpler: most packages failed in this fresh, unprivileged, secret-free container, even though several service and utility areas passed. A production candidate needs the complete test log and a successful rerun.
Komari's 131-second test step also cost far more time than its 20-second build, so skipping it would hide the main warning in our run. Keep the first failure and environment diagnostics when reproducing the suite. If packages require PostgreSQL, SQLite files, browser assets, network listeners, or other fixtures, those requirements should be made explicit only after the full log proves them.
Monitoring access also grants control access
The README carries an unusually direct warning: Komari is a monitoring and control application, and users should deploy it only on systems they own or are authorized to manage. The web terminal visible in the screenshots explains why. A stolen dashboard account may offer more than graphs. Put the service behind HTTPS and strong authentication, restrict its network reach, and treat every agent registration token as an administrative secret.
Release 1.4.3 expands that concern by adding administrator-only RPC for raw SQL queries and writes against the main or metric database. The release says it applies row limits and parameter binding, but the endpoint still has deliberate write authority. The same version improved backup uploads, plugin reloads, upgrade rollback, and cleanup of historical backups. Confirm that access logs capture use of powerful operations and keep backups outside the application host.
PostgreSQL and Windows users have specific open failures
Issue 651 reports that real-time writes repeatedly time out when the metric store uses remote PostgreSQL, while local SQLite works for the reporter. That finding matters to operators who choose PostgreSQL for separation or scale. Reproduce sustained ingestion across the actual network before migrating history, and verify that delayed writes do not create silent gaps. The issue was open when GitHub data was fetched.
Issue 655 reports an agent installation failure on Windows when the user name contains a space. That is narrower and easier to test: install under the same account naming policy used across the fleet. Issue 650 reports abnormal node traffic totals after upgrading to 1.4.3. Because traffic history is a monitoring output people may bill or alert from, compare counters before and after an upgrade instead of assuming continuity.
Release 1.4.3 is active, with Chinese-first release notes
GitHub recorded 6,024 stars, 10 open issues and pull requests combined, and a last push on August 29, 2026. Release 1.4.3 was published on August 13. The active push date and recent responses show ongoing work. The release notes are written in Chinese, even though the repository has an English README, so some English-only operators will need translation to inspect upgrade details and removals.
Komari earns a trial when the desired outcome is a readable view of a small fleet, updated every second, without deploying a large metrics stack. Our build result supports that trial; the 49 failed packages prevent an unqualified recommendation from source. Run the complete suite, test metric storage and upgrade continuity, and isolate the dashboard as a control plane. If remote terminal and SQL authority are unwanted, choose a monitor with a narrower security boundary.