A metrics endpoint leaves dashboards and alerts to your stack
Node Exporter reads operating-system and hardware counters and exposes them for Prometheus to scrape. CPU activity, available memory, filesystem space, and network traffic are ordinary examples. You choose collectors for the host you're watching, then use a separate monitoring system to retain the samples and decide when something deserves an alert. For an existing Prometheus deployment, that separation makes the exporter a sensible, focused addition.
The measured checkout was 2.9 MB across 414 files, with about 35,234 lines of source. Its modest repository size shouldn't obscure the deployment decision: the exporter must see the machine you intend to monitor. The README explicitly warns that a container can report on itself unless you expose the host correctly. A reachable endpoint and a successful scrape aren't enough to prove that the numbers describe your server.
What happened when we ran it
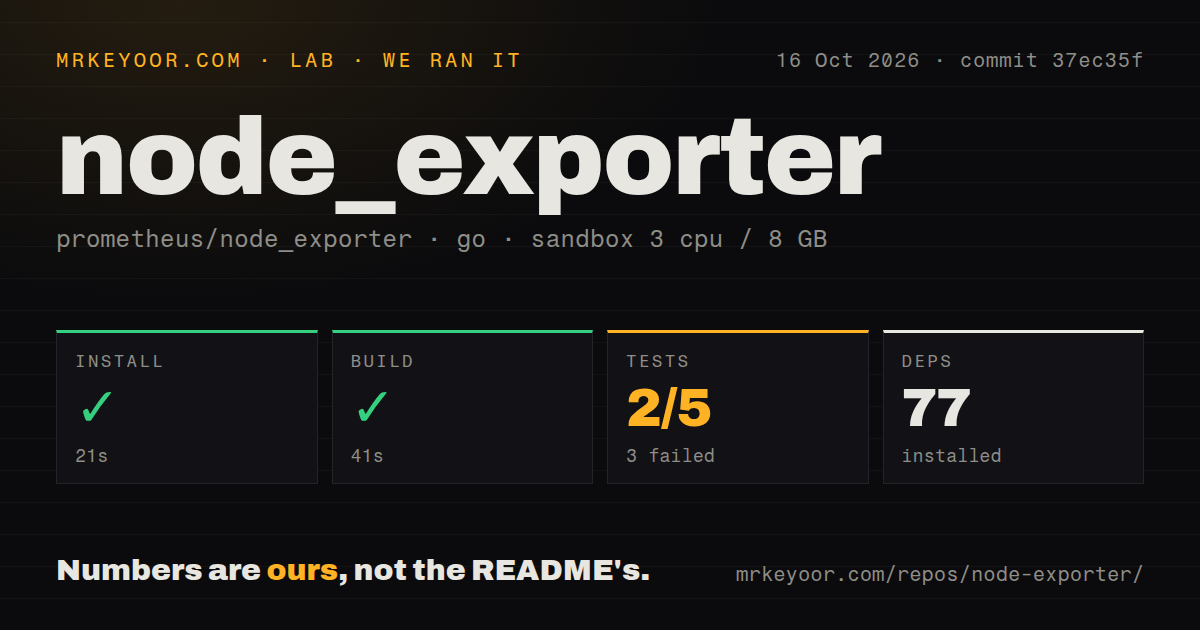
Our run installed Node Exporter at commit 37ec35f in 21 seconds, fetching 77 packages, and built it successfully in 41 seconds. The October 16, 2026 sandbox used the Go 1.24 Bookworm image with 3 CPUs and 8 GB of RAM. It was unprivileged and had no secrets. These results support a straightforward source build on that measured path, without establishing production collector behavior.
The test step exited with code 1 after 8 seconds. The lab's summary recorded 2 passed and 3 failed out of 5 reported results. The tail separately names failures for DM multipath, ethtool, Fibre Channel, mdadm, NUMA memory, NVMe subsystems, PCI name resolution, and watchdog statistics. That list isn't a reliable basis for replacing the summary with a new individual-test total. The collector package ended in failure.
The supplied tail contains failure names, not the assertions or underlying errors. It doesn't establish a missing system package, insufficient privileges, or a collector defect as the cause. Our scan also found 6 CI workflow files and a Dockerfile, but no tests directory. That directory signal clearly doesn't mean there are no tests: the actual command ran and failed. Investigate the complete failures before claiming a green source checkout.
Host mounts decide which machine a container describes
The documented container deployment shares host networking and the host PID namespace, then mounts the host root read-only at /host. The --path.rootfs=/host argument must match that mount. Other mount points you want to monitor need to be exposed too. This requires more host access than an isolated application container, and some platforms won't permit that deployment shape.
The 41-second build doesn't settle those permissions. The README says the timex collector needs an extra capability on some systems, while perf access depends on kernel configuration and security settings. Treat each enabled collector as a requirement to verify against the target host. If your platform prohibits the necessary access, switching image tags won't resolve the policy mismatch. Use a host-managed exporter or another approved source of those metrics.
Optional collectors can exceed your scrape budget
The README explains why some collectors ship disabled: too many distinct metric series, long collection times, or substantial host resource demands. It recommends enabling them individually and watching scrape duration and sample counts. Systemd, ethtool, and perf are among the optional choices. Start with counters you have a reason to use. Collecting everything creates more storage and troubleshooting work without guaranteeing a useful alert.
Our 8-second failed test step supplies no production scrape-speed measurement. You must measure collection on your own hosts, with their devices and enabled collectors. Filesystem and network filters help exclude unwanted mounts or interfaces. Check the resulting series against an inventory rather than assuming the default view matches your fleet. That matters particularly on machines with container mounts, many interfaces, or specialized storage hardware.
Text files cover machine jobs, with limits
The textfile collector reads Prometheus-format files from a configured directory. A local job can write its completion information to a temporary file and rename it into place, following the README's example. This is useful for host-specific work such as a scheduled maintenance task. Timestamps in those files aren't supported, and the README directs service-level batch metrics toward Pushgateway instead. Choose the mechanism according to what the metric describes.
The exporter itself doesn't require a hosted API account. You still need a scraper, network access to the endpoint, and somewhere to retain and inspect samples. The 77-package source setup says nothing about that operating stack. The README also documents web configuration for TLS and labels that support experimental. Decide how the scraper reaches the endpoint and who can reach it before distributing the same service configuration across your hosts.
October maintenance supports adoption, with a failed local suite on record
The last push was October 15, 2026, and issue activity continued on October 16. GitHub listed 13,848 stars and 324 open issues and PRs when checked on October 17. The latest release, v1.12.1 from July 14, fixes perf flag handling and optional EDAC collection. The recent activity supports a maintenance judgment that the release date alone couldn't supply. None of it erases our failed test result.
Use Node Exporter when Prometheus already owns your monitoring and you can grant the exporter the correct host view. Choose Windows Exporter for Windows, as the README recommends. Telegraf fits teams needing configurable inputs and outputs across more data sources, while Netdata is worth considering for an integrated monitoring interface. Before adopting Node Exporter fleet-wide, confirm that its filesystem metrics describe the actual host mounts and investigate the collector failures from your chosen revision.