Per-second dashboards appear before you design a query language
Netdata installs an agent that discovers host resources, containers, services, and supported applications, then produces charts and alerts without requiring a dashboard project first. The README describes per-second collection, local storage, anomaly detection, log access, synthetic checks, and hundreds of integrations. For an operator staring at an unfamiliar server, that immediate breadth is the main reason to try it.
The product model differs from a typical Prometheus and Grafana deployment. Each agent collects, stores, scores, and serves its own data. Parent nodes can centralize longer retention and shared views, while optional Netdata Cloud adds remote access, role-based controls, and fleet dashboards. Metrics remain in the user's infrastructure according to the README. The convenience comes from accepting Netdata's data model and generated interface rather than composing every query and panel yourself.
The local agent and hosted coordination have different terms
The ecosystem table lists the Netdata Agent under GPL v3+ and the Netdata UI under NCUL1. Netdata Cloud is a separate component with enterprise features and a free community tier. A buyer should read all three arrangements instead of assuming the repository's GPL label describes every screen and service involved in a fleet deployment.
A single host can stay local and open its interface on port 19999. Remote access should sit behind a firewall, tunnel, or authenticated proxy rather than be exposed casually. Connecting nodes to Cloud is optional, but teams that use it should document account ownership, role assignment, and offboarding. Those decisions are operational policy, not a side effect of the one-line installer.
What happened when we ran it
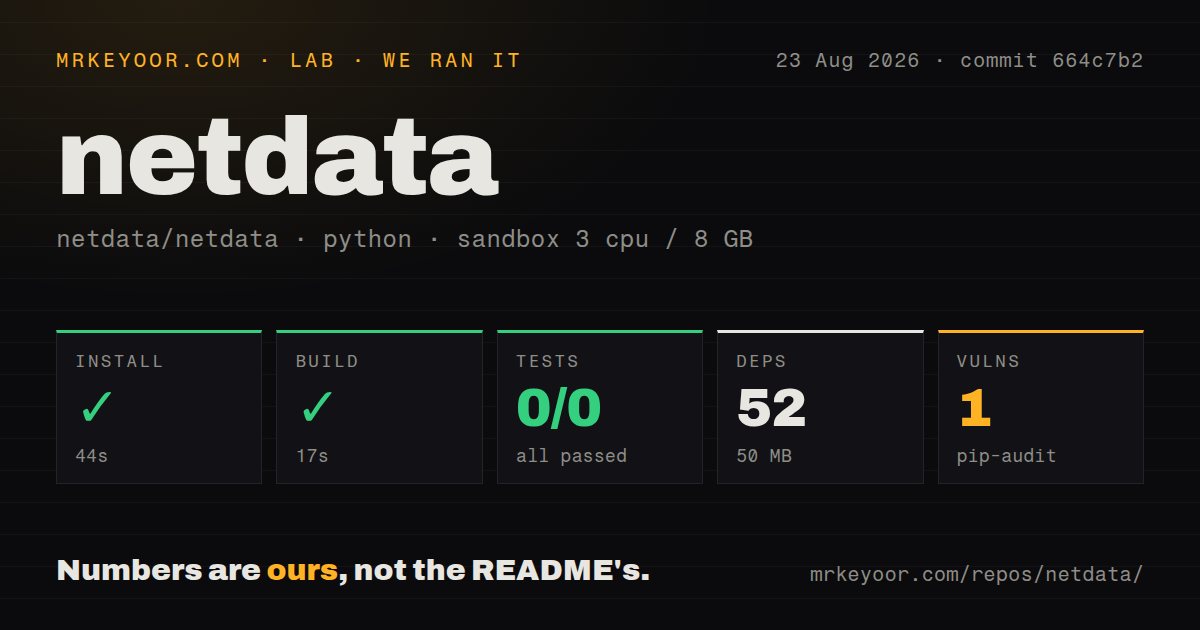
Our sandbox did not build the monitoring agent. The detected Python project lives in packaging/dag/, where installation succeeded in 44 seconds with 52 packages and 50 MB on disk. That subproject built in 17 seconds. The run used commit 664c7b2 in an unprivileged Debian container with 3 CPUs and 8 GB of RAM.
Pytest exited with code 5 after 16 seconds because it collected 0 tests: 0 passed and 0 failed. Its only log detail is a collection warning stating that Click's callable named test could not be collected because it is not a function. Pip-audit reported 1 known vulnerability. The evidence does not name the affected package or advisory, so we cannot state its severity or applicability.
The entire checkout held 12,395 files, about 1,619,198 lines of source, and occupied 215.1 MB. It contained 27 CI workflow files and a tests directory, while the scanner found no root Dockerfile. None of those signals changes the scope problem: our measured install, build, audit, and pytest result belong to the packaging DAG, not the Netdata Agent or UI.
Current host-specific reports justify a real pilot
Open issue 23622 describes an aarch64 host where the system.interrupts collector created a new dimension roughly once per second. The reporter measured resident memory rising from 921 MiB to 1.85 GiB over 3 days. Issue 23597 separately reports metadata memory growth on v2.11.0, and issue 23558 reports high Docker daemon CPU while Netdata monitored an otherwise quiet host.
These reports are specific environments, not universal resource measurements. They do make a pilot mandatory for small machines and high-cardinality systems. Install on a representative host, record the agent's memory, database size, dimension count, and induced collector load over several days, then compare the charts with operating-system counters. Automatic discovery can find useful data and can also discover more than the host can comfortably retain.
Windows and ML claims need output checks
The README describes edge-trained anomaly models for each metric and automatic scoring. Open issue 23630 says the ML test suite still passed after the reporter changed the decision function so it could never fire, and again when it always fired. That is a test-coverage claim with reproduction detail, not proof that deployed anomaly detection is wrong. It does mean teams should validate alert behavior using known incidents rather than trusting a green internal suite alone.
Windows coverage also varies by host. Issue 23482 reports CPU charts near twice the expected value on a hybrid Intel processor because a legacy performance counter returned zero idle time. Compare Netdata with Task Manager or another counter source on each hardware family before building capacity alerts. Monitoring that reports the wrong denominator can be more dangerous than missing a chart because the output still looks precise.
August 2026 maintenance is active and security-focused
GitHub showed 80,312 stars and 391 combined issues and pull requests when fetched. The source was pushed on August 27, 2026, and v2.11.0 was released on August 12. Its notes include MCP bearer-token protection, a decompression-bomb guard, access checks, memory fixes, collector changes, and several correctness repairs in queries, streaming, databases, and alerts.
The MCP work makes mcp an appropriate tag here, but it also creates another endpoint to secure. Release notes say anonymous callers receive less metadata and MCP functions use a dedicated access list with bearer protection. That is a better default than an open tool interface. Netdata remains most convincing as a fast diagnostic layer on tested hosts. The repository activity is strong; the unanswered question is how its collectors behave on your kernels, containers, hardware counters, and retention settings.