One service covers the checks most small teams need
Uptime Kuma watches HTTP and TCP endpoints, page keywords, JSON responses, WebSockets, ping, DNS records, push signals, game servers, and Docker containers. It can alert through Telegram, email, Slack, Discord, and more than 90 other notification services. The same application publishes multiple status pages, maps them to domains, shows certificate details, and records ping history. That covers a small team that wants outage signals without first designing an observability platform.
The 20-second minimum interval is a useful dividing line. It is responsive enough for public services, while remaining an availability checker rather than a system for querying application metrics. Uptime Kuma tells you that an endpoint stopped answering or a certificate is nearing expiry. It does not replace traces, log search, capacity dashboards, or Prometheus alert rules.
The Docker start is the product's strongest argument
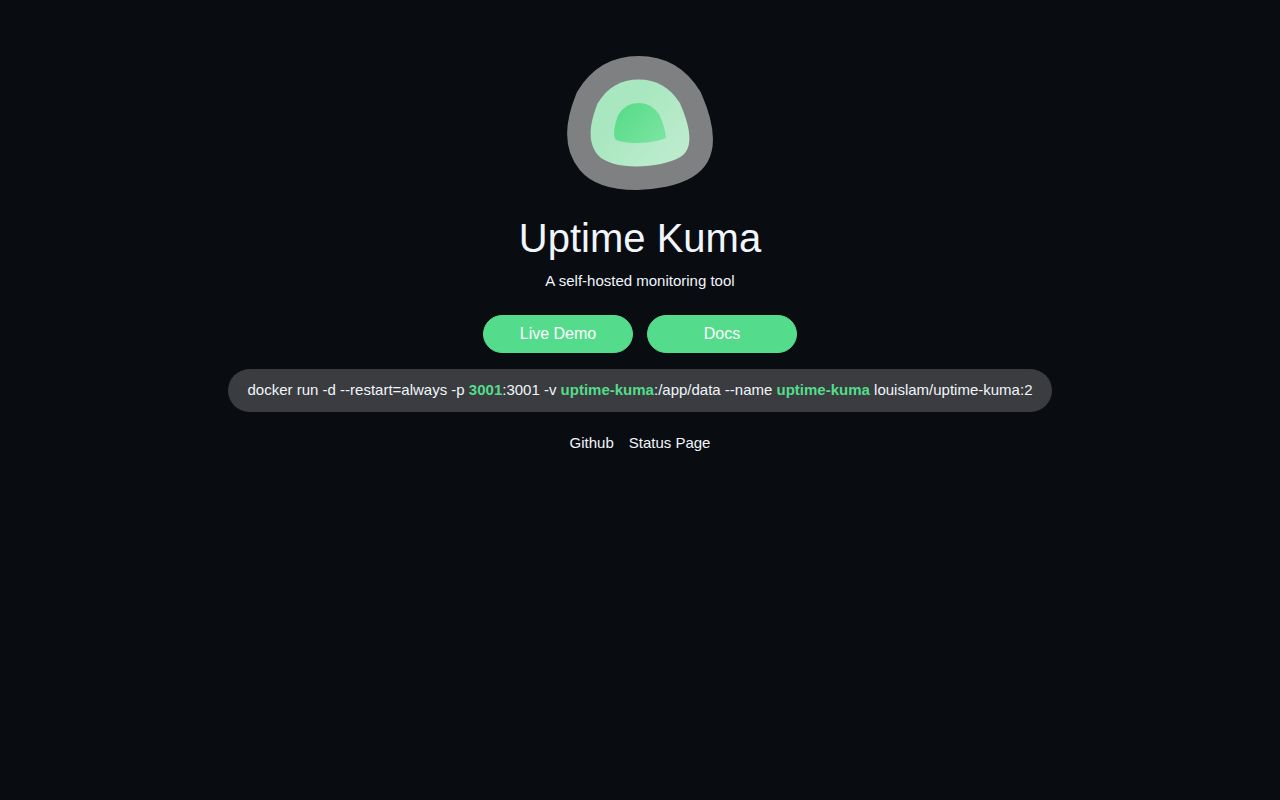
The README's preferred setup is short: fetch its Compose file and run docker compose up -d. A single-container command is also documented, with port 3001 and a named volume for /app/data. There is no database cluster to provision, and a temporary demo lets you inspect the interface before installing anything.
The published commands expose port 3001 on every interface, so bind it to 127.0.0.1 when a reverse proxy will provide access. Keep the data on a local directory or Docker volume. The README states that NFS is unsupported, which rules out placing the service directory on a network share. Backups must include the persistent data volume.
A source install is a different proposition. Major Linux distributions and current Windows releases are supported, while the BSD family, Replit, and Heroku are explicitly excluded. You need Node.js 20.4 or newer, Git, and PM2. The background setup adds PM2 log rotation and startup persistence.
What happened when we ran it
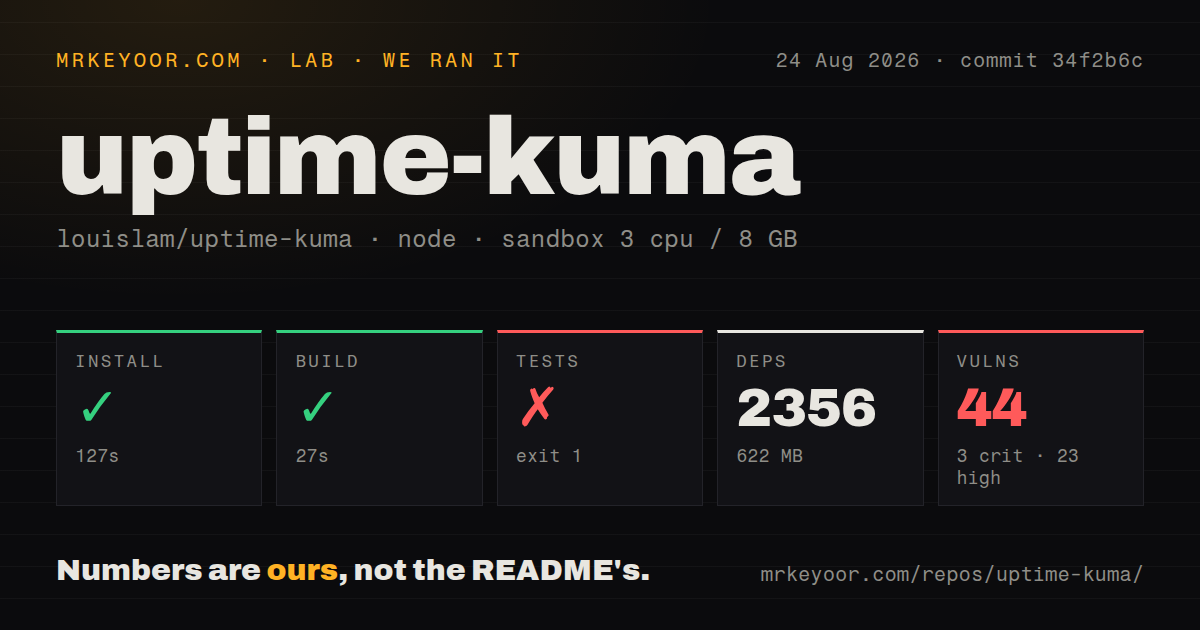
Our sandbox installed the repository in 127 seconds. npm added 2,356 packages and the checkout consumed 622 MB on disk. The build completed in 27 seconds. The repository contained 785 files and about 77,075 lines of source at commit 34f2b6c, so the source path is much heavier than the Docker quick start suggests.
The test command failed with exit code 1 after 71 seconds. Its final output showed ConditionExpressionGroup.fromMonitor passing, including a check that tries all nodes before failing, followed by a generic failing tests line. It did not name the failed case in the supplied tail, so there is no honest basis for blaming a package, Node version, or application defect.
npm audit found 44 known vulnerabilities: 3 critical, 23 high, 16 moderate, and 2 low. That result does not prove that every advisory is reachable through the server. An operator exposing a dashboard, storing notification tokens, and possibly connecting to Docker or databases should still inspect the dependency report and current image before deployment.
Status pages are useful, while access still needs care
Multiple status pages and custom-domain mapping make Uptime Kuma more useful than a private checker. An agency can separate customer services, and a product team can publish only the monitors customers should see. Proxy support and two-factor authentication help with administration. The localhost-only port binding is the right starting point when a gateway will terminate TLS.
Monitor configuration can carry SMTP passwords, notification tokens, proxy credentials, database logins, and Docker access. The README cannot decide whether mounting the Docker socket is acceptable or whether a public page reveals internal names. For critical services, keep a second alert path outside the same host so a server failure does not silence the application and its monitor.
Active maintenance does not erase the upgrade queue
The repository was pushed on August 26, 2026, and release 2.5.3 arrived on August 22. Recent activity includes dependency updates and fixes around proxy authorization, gRPC deadlines, and PostgreSQL connections. Its GitHub total of 790 combines issues and pull requests, so it is a busy work queue rather than 790 confirmed defects.
That queue matters during upgrades. One open report describes group monitors remaining pending after a move from version 1.x to 2.4.0. Another reports Teams webhook changes breaking notifications. Pin the deployed image, read release notes, back up /app/data, and verify every important notification after an upgrade. A green dashboard means little if its alert route stopped delivering.
Choose it for clarity, then operate it like infrastructure
Uptime Kuma succeeds because an administrator can understand the product quickly. Gatus is better when configuration must live in Git. Blackbox Exporter fits an existing Prometheus estate. Healthchecks is narrower for scheduled jobs alone.
For its audience, Uptime Kuma is the easiest recommendation of those options. Use the Docker route, keep port 3001 behind a trusted gateway, store data locally, and test alerts after every change. The failed source test exit and 44 advisories prevent a carefree recommendation, especially where the monitor holds powerful credentials. Its practical advantage remains: one understandable service can replace scattered uptime checks and status-page scripts.