Kibana makes sense only when Elasticsearch is the center
Kibana is the interface Elastic builds for data stored in Elasticsearch. It covers querying, analysis, visualization, dashboards, and cluster-facing management. Product areas extend into observability and security, but the architectural decision stays simple: Elasticsearch is the data engine underneath. If your company already indexes logs, traces, documents, or security events there, Kibana is the default interface to evaluate.
That coupling is a strength and a constraint. Kibana understands Elastic concepts and ships alongside the stack instead of treating Elasticsearch as one optional connector among many. A team using Prometheus, SQL warehouses, Loki, and several cloud services may prefer Grafana as a shared presentation layer. A team on OpenSearch should start with OpenSearch Dashboards, whose plugins and release cadence follow that engine.
A 12.7-million-line checkout changes the contributor experience
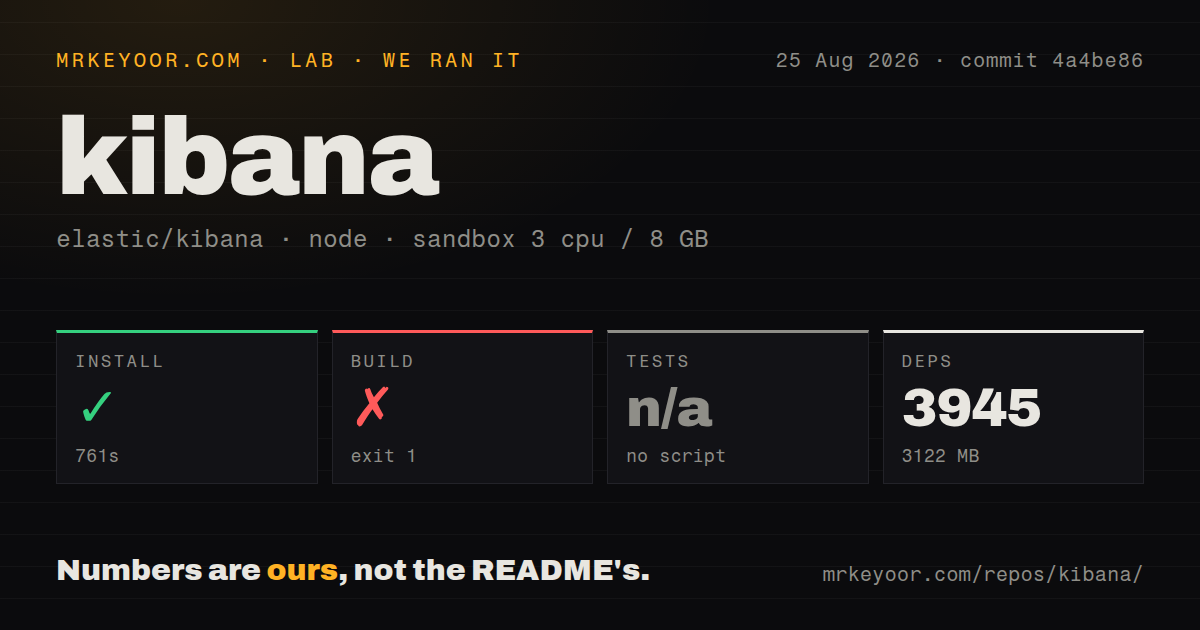
commit 4a4be86 occupied 1,043.5 MB and contained 119,039 files with about 12,744,249 lines of source. Our Yarn install succeeded, but it took 761 seconds, added 3,945 packages, and used another 3,122 MB on disk. This is a product monorepo, not a dashboard library you casually patch between other tasks.
The root scan found 58 CI workflow files. That is consistent with a project supporting many applications and test lanes, though GitHub's combined 14,265 open issues and pull requests also shows the coordination burden. Contributors should use the repository's CONTRIBUTING.md and style guide, preserve the expected tool versions, and plan for caches that make repeated work affordable.
What happened when we ran it
Our sandbox completed the 3,945-package install in 761 seconds on 3 CPUs with 8 GB of RAM. The distributable build ran for 38 seconds and failed with exit code 1. Its tail showed readPackageMap calling Node's readFileSync during copy_legacy_source_task.ts, followed by Yarn reporting that the command failed.
The supplied tail does not include the missing path or the earlier error message, so claiming a specific absent file would exceed the evidence. The useful finding is that commit 4a4be86 did not produce a distributable in our fresh Node 22 container. There was no test script or target in the lab's detected path, so tests were skipped. No Dockerfile was present at the repository root.
Matching Elasticsearch versions is an operating requirement
The README recommends matching Kibana and Elasticsearch version numbers. It documents warnings for some patch differences, but fatal startup errors for an Elasticsearch major newer than Kibana, an Elasticsearch minor older than Kibana, or an Elasticsearch major older than Kibana. Those examples turn upgrades into a coordinated stack change rather than two independent package bumps.
Use a tested compatibility matrix and stage both services with representative saved objects, dashboards, authentication, plugins, and data volumes. The latest GitHub release returned by the API was Kibana 9.5.2, published August 20, 2026. That number is useful only when paired with the Elasticsearch version you will run. Installing whichever release is newest on one side can take the pair outside the documented relationship.
Release packages are the sensible trial path
The README directs ordinary evaluators to Elastic's getting-started material, a downloadable release, or Elastic Cloud. Source builds are for contributors, testing current changes, and working on open pull requests. Our 799 seconds of install-plus-failed-build time supports that distinction. A packaged release removes the monorepo build from the evaluation, while Cloud also removes most service operation.
Self-hosting still buys control over placement, access, upgrades, and data paths. It also makes your team responsible for Elasticsearch capacity, Kibana availability, TLS, authentication, saved-object migrations, and version coordination. Cloud changes that responsibility and adds vendor cost. The right comparison is the staff time and control model, not whether either option can display a bar chart.
Scale produces both deep coverage and visible churn
GitHub showed 21,262 stars and 14,265 combined issues and pull requests when fetched. The repository was pushed August 26, 2026, with issue and pull-request updates arriving within minutes of the API call. One current issue tracked a failing Chrome functional test for connector deletion; another tracked a failing custom-status alert test. These are specific CI reports inside a huge project, not evidence that the released product broadly fails.
The activity is the clearest health signal. Release 9.5.2 was 6 days old, the main branch was receiving work, and 58 workflows were visible. The queue size should not be mislabeled as 14,265 bugs because GitHub includes pull requests. For adopters it means answers and fixes live in a busy system where product area, version, and reproduction quality matter.
License review belongs before extension work
GitHub's repository endpoint returned no asserted SPDX license identifier. Kibana has had licensing changes across its history, so a current buyer should read the license files for the exact branch and distribution instead of borrowing an old summary. This matters most for companies that intend to modify, redistribute, embed, or offer the software as a service.
Kibana remains the strongest fit for an organization that has already chosen Elasticsearch and wants the surrounding Elastic applications. Its maturity does not make source contribution light: our checkout crossed 12.7 million lines, and the build failed after an expensive install. Start with the matching 9.5.2 release or Cloud, prove the product value, then enter the source tree only when you have a concrete reason.