
mrkeyoor.com_
Sun 27 Sept 17:33 UTC
Dataevaluationupdated 27 Sept 2026

data-formulator review

Data Formulator is a visual workspace where an AI analyst loads data, answers questions, produces editable charts, and keeps each line of inquiry in a branching thread. It helps analysts move between files, databases, transformations, and reports without reducing the work to one long chat transcript.

Verdict

Our Data Formulator run installed 1,050 packages, built in 57 seconds, and passed all 391 tests, which makes it the strongest-tested project in this batch. Use it for exploratory analysis where a person reviews the data, generated work, and chart before sharing the result. Choose a conventional BI tool when governed metrics and predictable dashboards matter more than branching AI investigation.

We ran it

Lab card: what happened when we ran data-formulatorScreenshot of data-formulator (data-formulator.ai)
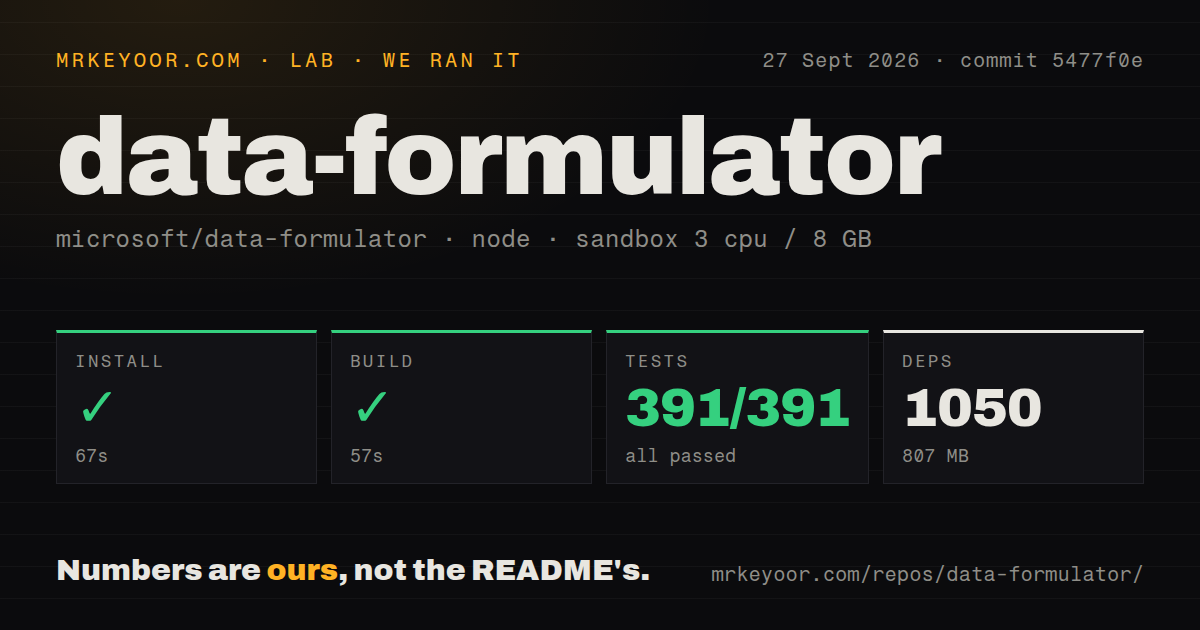
Install✓ · 67s1050 packages · 807 MB
Build✓ · 57s
Tests✓ · 34s391 passed · 0 failed of 391 (vitest)
Repo689 files~136,350 lines of source · 28.1 MB · 2 CI workflows · Dockerfile · tests dir

Answers from our run

Does data-formulator build from source?

Dependencies installed in 67 seconds (1050 packages), and the build succeeded in 57 seconds. We cloned commit 5477f0e into a clean Debian container with 3 CPUs and no project-specific setup.

Do data-formulator's tests pass?

Yes: 391 of 391 passed when we ran the project's own test command (vitest). Some failures need services or credentials a bare container does not have.

Who should not use data-formulator?

Teams that require every metric to come from an existing semantic layer: open issue 427 requests that integration because the app mainly works from underlying data and schemas today.

What are the alternatives to data-formulator?

LIDA, Evidence, Apache Superset. Our Data Formulator run installed 1,050 packages, built in 57 seconds, and passed all 391 tests, which makes it the strongest-tested project in this batch.

Setup4/5All checks passed; model and deployment settings still take care
Docs5/5Local, Docker, sandbox, identity, and storage paths are explicit
Community5/517,410 stars with issue and pull request activity this week
Maturity4/5391 tests passed, though v0.8 remains a beta release

Who it’s for

Analysts who want to ask follow-up questions while keeping tables, charts, and earlier branches visible.
Data teams willing to review generated transformations before using their conclusions.
Developers connecting CSV, Excel, JSON, databases, cloud storage, or governed internal data to an AI workspace.
Self-hosters who can configure model credentials, workspace storage, authentication, and code-execution isolation.

Who it’s NOT for

Teams that require every metric to come from an existing semantic layer: open issue 427 requests that integration because the app mainly works from underlying data and schemas today.
Public anonymous deployments that must expose database connectors or custom model endpoints: the deployment guide says to disable both because browser identity is unsuitable for protecting durable credentials.
Users expecting every Ollama model to work well without evaluation: open issue 362 asks for a known-good model list after several local models failed for its reporter.
Workflows built around a text-only model for chart commentary: open issue 398 reports that chart insight can return a generic model error when image input is unsupported.
Organizations that require signed desktop binaries: the README labels current Windows and macOS archives as unsigned preview builds.

Setup reality

Our sandbox installed 1,050 Yarn packages in 67 seconds and used 807 MB. The build succeeded in 57 seconds, then Vitest passed all 391 tests in 34 seconds. The 28.1 MB checkout contained 689 files and roughly 136,350 lines of source.

Useful analysis needs a model connection such as OpenAI, Azure, Anthropic, or Ollama. Database and cloud connectors add their own credentials. Local single-user mode can store workspaces under the home directory; authenticated shared deployments need an identity provider and suitable persistent storage.

The default local sandbox executes generated Python in a restricted warm subprocess. Stronger Docker isolation requires running Data Formulator on the host because its Docker sandbox is not supported from inside the app's own container. Desktop preview archives are not code-signed or notarized.

A branching thread keeps the analysis inspectable

Data Formulator does more than turn a prompt into a chart. You load a file, connect a database, or ask its analyst to locate data, then review the proposed material before it enters the workspace. Each question produces an explanation, table, or editable visualization inside a Data Thread. You can branch from an earlier step instead of dragging stale assumptions through a single conversation. That history is the part ordinary chat-based analysis often loses.

The interface accepts CSV, TSV, Excel, JSON, screenshots, text, databases, and data platforms. Its current chart system uses Flint and the README describes more than 30 chart types in the v0.7 line. Our checkout was substantial: 689 files, about 136,350 source lines, and 28.1 MB before installation. The size reflects a TypeScript frontend, Python backend, connectors, desktop packaging, workspaces, agents, and code-execution controls rather than a thin chart wrapper.

The app can run locally, but useful answers still need a model

The easiest trial is uvx data_formulator, a pip install, or Docker Compose. A local server opens on port 5567. Windows and macOS desktop archives are also produced by CI, though the README warns that current previews are not signed or notarized. Users must consciously bypass the operating-system warning and should obtain those archives only from the project's workflow artifacts or releases.

Model access is a separate choice from installation. Data Formulator supports OpenAI, Azure, Anthropic, Ollama, and other routes through LiteLLM. Hosted providers need API keys; local Ollama use shifts the burden to model selection and hardware. Open issue 362 comes from a user who could not find a satisfactory local model even with 8 GB of VRAM and 32 GB of system memory. That report is one experience, but it shows why an offline label does not guarantee useful analysis.

What happened when we ran it

Our unprivileged Debian sandbox cloned commit 5477f0e and installed 1,050 Yarn packages in 67 seconds. The installed tree used 807 MB on disk. That is a fairly large developer environment, yet the setup completed without an error in the supplied log. The repository also includes two CI workflow files, a Dockerfile, a Compose file, and a tests directory.

The production build completed in 57 seconds. Vitest then finished in 34 seconds with 391 passed and 0 failed out of 391. No test was reported as skipped in the measurement block. Those results establish that the checked-out frontend built and its available Vitest suite passed on 3 CPUs and 8 GB of RAM. They do not measure database connector coverage, model answer quality, chart accuracy, or desktop signing.

This distinction matters because the hardest failures happen after the tool starts. An agent can select the wrong table, write a plausible transformation, or interpret a chart badly while every unit test stays green. Data Formulator makes intermediate tables and branches visible, which gives a reviewer somewhere to catch those mistakes. The 391 passing tests support the software mechanics; a human still owns the analysis.

Generated Python makes the sandbox a deployment decision

AI-generated Python runs in a sandbox. The default local backend keeps a warm subprocess and blocks file writes plus dangerous operations through audit hooks. The stronger option launches each execution in a disposable Docker container with a read-only workspace and resource limits. The documented trade is about 1 ms of overhead for local execution versus roughly 700 ms for Docker. These are project claims from the development guide, not figures from our lab run.

There is one deployment trap: the Docker execution backend does not work when Data Formulator itself runs inside its Docker image. Its child container needs host paths for bind mounts, but paths inside the parent container do not refer to the host. To use Docker isolation, run the application directly on the host. A public anonymous instance should use ephemeral workspaces and disable data connectors, custom models, and key display. Authenticated shared use needs OIDC, GitHub, or Azure identity plus properly scoped storage.

Active development comes with beta boundaries

GitHub showed 17,410 stars, 1,708 forks, and 107 combined issues and pull requests on September 27, 2026. The repository was pushed that same day, with new pull requests and dependency work updated within hours. That is healthy current activity, though the combined count should not be read as 107 bugs. The latest release is 0.8b1 from August 15, while the README still directs general users to stable v0.7.

A few open reports define the edge of the current product. Issue 398 says chart commentary can fail with an unhelpful error when a text-only model receives an image request. Issue 427 asks for semantic-layer support so governed measures and relationships do not have to be inferred from raw schemas. Data Formulator is therefore best at supervised exploration. Its 57-second build and 391 passing tests make it easy to justify a trial, but the final chart should leave the workspace only after someone checks its source, transformation, and claim.

Alternatives

ProjectWhat it isPick it when
LIDAA library for generating visualizations and infographics with language models.pick this instead when you want a programmable chart-generation component rather than a persistent analyst workspace.
EvidenceA business-intelligence framework that turns SQL and Markdown into versioned reports.pick this instead when analysts should publish reviewed SQL-as-code pages rather than explore through an agent.
Apache Superset gh↗A multi-user data exploration and dashboard platform with a broad connector ecosystem.pick this instead when governed dashboards, roles, and established BI operations matter more than conversational analysis.

What people are saying

  1. [github-trending] microsoft/data-formulator

Sources

  1. Data Formulator repository
  2. Data Formulator development and deployment guide
  3. Data Formulator 0.8b1 release
  4. Local Ollama model issue
  5. Text-only chart insight issue
  6. Semantic layer feature request

More data reviews

toasty · gfwlist · simdjson · go-stock · sqlitebrowser · hydradb · the whole board →