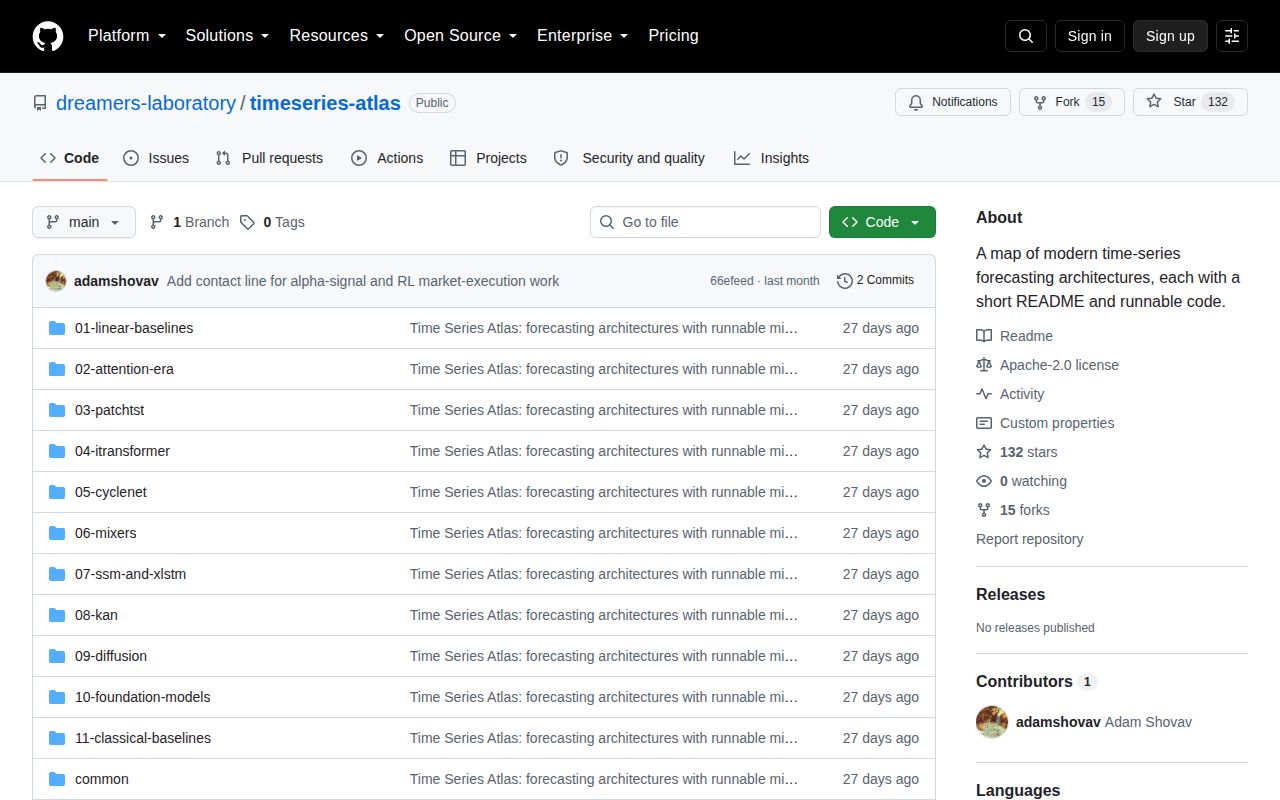
Eleven stops make the model history easier to compare
Time Series Atlas arranges forecasting work into 11 directories, beginning with linear and classical baselines and ending with pretrained models. The useful move is comparison. DLinear sits near attention-era models, PatchTST and iTransformer get their own chapters, and newer mixers, state-space models, diffusion methods, and foundation models are placed in the same map. Each note explains the mechanism in plain technical language and points to papers or original code.
Only 4 architecture directories contain self-contained implementations: linear baselines, PatchTST, iTransformer, and CycleNet. The shared trainer also exposes NLinear, giving 5 model choices in its command-line argument. Everything else is a guided tour or a small demo that depends on another package. That boundary keeps the repository readable, but it rules out treating the atlas as a uniform benchmark suite.
The common trainer forces every model to face seasonal naive
common/train.py puts the compact models through one data pipeline and prints MSE and MAE beside a seasonal-naive forecast. Defaults include a 96-step lookback, a 96-step horizon, 5 epochs, and a batch size of 64. With no ETTh1 file present, the data helper supplies a synthetic multi-seasonal series. The fixed random seeds make those tutorial runs easier to compare.
That is a sound teaching constraint. A complicated architecture should at least clear a baseline that repeats the last seasonal period. It is not an empirical verdict on forecasting as a whole. Synthetic data can show that a model and tensor shapes work, while production demand, sensor, finance, or traffic series bring missing values, revisions, regime shifts, uneven sampling, and covariates that this trainer does not claim to cover.
What happened when we ran it
Our sandbox did not execute install, build, or tests for commit 66efeed. The detector saw Python source, but it found no supported ecosystem and no Dockerfile. There are therefore no measured installation seconds, dependency totals, disk figures, build results, or test counts for this repository.
The README's pip install torch numpy line is a manual instruction, not a result from our box. We did not convert it into a substitute benchmark or infer that the examples pass. For a fair trial, create a clean environment, pin the PyTorch and NumPy versions, run each selected command, and retain its console output. Add the ETTh1 download only after the synthetic path works.
The repository explains choices better than it packages them
There is no pyproject.toml, setup.py, requirements file, or Dockerfile in the tree we inspected. The basic examples import PyTorch and NumPy directly. The foundation-model demos ask for chronos-forecasting or timesfm, while the classical demo points to statsforecast and pandas. Each path can produce a different dependency graph, so one global install command would hide meaningful differences.
For a reader, that light structure is pleasant. The DLinear note is short enough to connect decomposition with the code in one sitting. For a team, it moves environment ownership to you. Pin a commit, make one requirements file per experiment family, log the dataset checksum and split, and record the baseline with the candidate. Those controls matter more than reproducing the atlas's folder order.
Late-2025 leaderboard figures need a fresh lookup
The foundation-model chapter records a late-2025 GIFT-Eval table covering 97 tasks. It lists Chronos-2, TiRex, TimesFM 2.5, Toto 1.0, Moirai 2.0, and Sundial, and it warns that the board is live. The same page notes license differences, including a noncommercial license for Moirai 2.0 and a separate community license for TiRex. Those details can decide whether a model belongs in client work before accuracy enters the discussion.
Use the chapter as a shortlist, then fetch the current leaderboard and the selected model's current license. The README itself argues that normalization, lookback length, and channel handling can reverse rankings. Any internal comparison should state those choices beside the score. Otherwise a small difference between two architectures says less about the model than the experimental protocol.
September activity is recent, while the release surface is thin
GitHub showed 132 stars, an Apache-2.0 license, and a last push on September 2, 2026. It showed 0 open issues and pull requests, and the latest-release endpoint returned no release. A quiet queue can mean the scope is small. It does not give a user versioned artifacts, changelogs, or a public record of how maintainers handle bug reports.
Time Series Atlas earns its place as a map. Its strongest advice is also its most practical: start with linear, seasonal-naive, and classical controls before spending time on the newest architecture. Keep the repository nearby for mechanism-level explanations. For repeatable experiments or deployed forecasts, use its questions and baselines inside a packaged toolchain that you can install, test, and freeze.