One table model covers metrics, logs, and traces
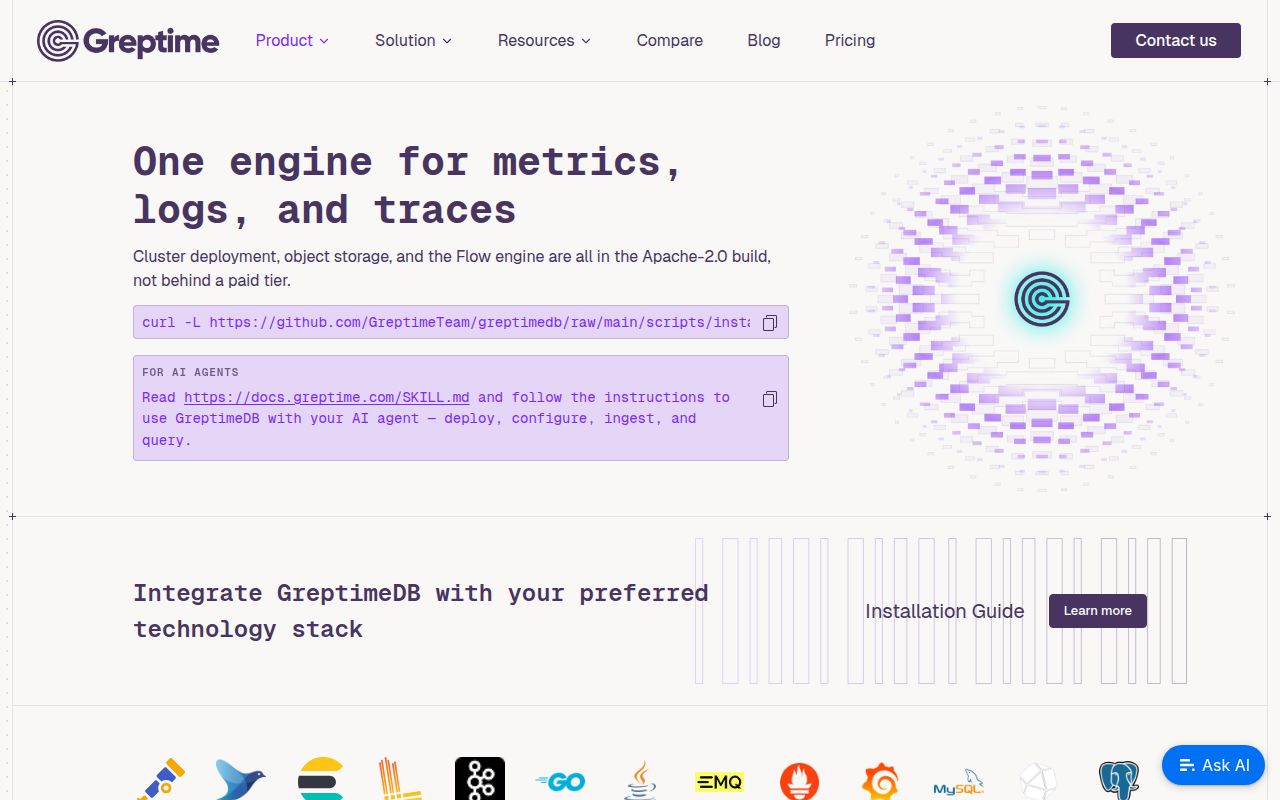
GreptimeDB stores 3 observability signals in the same columnar engine: metrics, logs, and traces. Tables share tags, timestamps, and fields, so a service name or trace ID can connect records through SQL. Ingestion includes OpenTelemetry, Prometheus Remote Write, Loki Push, Elasticsearch Bulk, InfluxDB line protocol, and gRPC. Queries use SQL, PromQL, Jaeger-compatible trace routes, or MySQL and PostgreSQL wire protocols.
The distributed design separates compute from durable object storage. Frontends accept protocols and run distributed queries, datanodes own regions and compaction, metasrv handles routing and metadata, and optional flownodes run continuous aggregation. S3, GCS, Azure Blob, and compatible stores are primary storage, with memory and local disk acting as caches. A standalone binary is available for development and smaller deployments, so evaluating the data model does not require assembling all 4 roles first.
What happened when we ran it
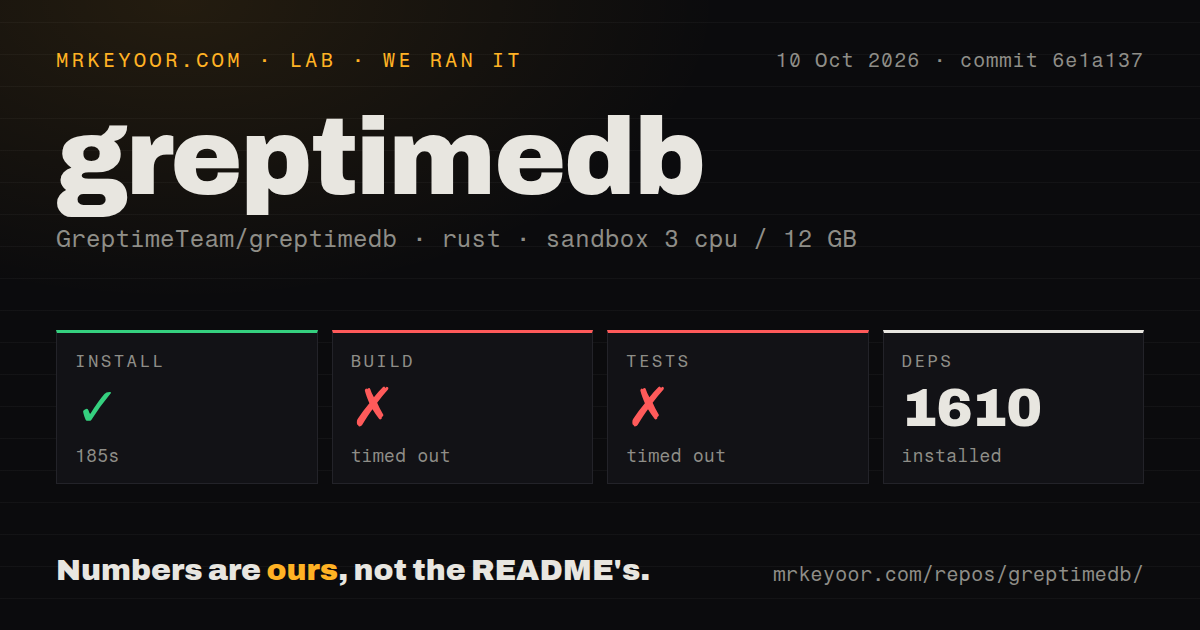
Our run cloned commit a932433 into an unprivileged Rust container with 3 CPUs, 12 GB of RAM, and no secrets. Installing dependencies succeeded in 207 seconds and brought in 1,579 packages. The 44.5 MB checkout contained 3,676 files and roughly 919,716 lines of source. Dependency setup finished, but it was only the beginning of the source-build cost.
The build reached our 900-second limit without completing. The test command also timed out after 900 seconds. Its final lines were compilation messages for crates including hyper, minijinja, the repository's standalone and cli packages, sqlness, and finally tests-fuzz. The log tail showed no failed assertion or completed suite, so the correct finding is a timeout during compilation, not a test pass or a diagnosed code defect.
The prebuilt container avoids the source compilation bill
The README's trial command publishes 4 local endpoints on ports 4000 through 4003 for HTTP, gRPC, MySQL, and PostgreSQL. It starts the official image in standalone mode and points to a dashboard on the HTTP port. Building from source is much heavier: the documented prerequisites include a pinned nightly Rust toolchain, Protobuf 3.15 or newer, GCC or G++, autoconf, and glibc development headers.
Our scan found 30 CI workflow files and a tests directory, but no Dockerfile in the checkout. That does not contradict the documented published image; it means the image recipe was not among the signals our harness found. Contributors also have several maintained commands to distinguish: formatting, Clippy, unit plus integration tests through cargo-nextest, and SQL regression tests through sqlness. A local cargo test alone does not represent that full matrix.
Apache-2.0 includes clustering, while automation has an edition boundary
The Apache-2.0 core includes cluster deployment, object storage, the Flow engine, and every ingestion protocol listed in the README. Repartitioning, region migration, and index creation are manual operations in that edition. Read replicas, workload isolation, automatic repartitioning, and enterprise security and governance sit behind the separate Enterprise license. That division matters more than the ability to start one standalone process.
A production comparison should price the operations your team must perform repeatedly. GreptimeDB v1.1.4 can distribute storage and compute without an Enterprise license, but a team expecting automatic data movement or isolated workloads will either write procedures around the core or pay for the additional edition. The README states this boundary directly, which makes the buying decision easier even if the answer sends some users elsewhere.
Protocol support eases ingestion but does not promise drop-in replacement
Prometheus Remote Write data can be queried with PromQL, though the documentation lists syntax and function gaps. Loki compatibility accepts Push ingestion but excludes LogQL and the rest of Loki's query API. Elasticsearch compatibility is narrower: the open-source core accepts _bulk, partial QueryDSL support belongs to Enterprise, and most Elasticsearch APIs are absent. Migration can be gradual at the ingestion edge, but dashboards and queries may need rewriting.
That makes GreptimeDB most convincing when SQL is part of the desired end state. A team can dual-write one signal, compare retained data and queries, and then decide whether consolidation is worth the query changes. Existing collectors do not guarantee existing alert rules or dashboards will work unchanged. The 3-signal pitch is credible at storage and ingestion level; compatibility remains specific to each protocol and direction.
Issue 9020 reports alpha JSON precision loss beyond u64
Open issue 9020 reproduces large JSON integers being accepted and stored as floating-point approximations in v1.3.0-alpha.1 on main. The report is explicit that ordinary BIGINT overflow fails loudly, while the JSON path can lose precision without an error. This is an alpha-branch report, not evidence about every stable deployment, but anyone storing huge numeric identifiers as JSON should add a round-trip case before adoption.
The stable release is v1.1.4, while main stayed active in September
Release v1.1.4 arrived on 2026-07-24 with fixes for Flow expiration units, MySQL timestamp precision, metadata caching, compaction scheduling, and credential sanitization. GitHub showed 6,610 stars and 244 combined open issues and pull requests on 2026-09-04. The default branch was pushed that day, and new or updated work covered WAL behavior, JSON precision, PromQL, Flow state, and storage. Release age and issue activity together point to active maintenance.
A 900-second cap makes source contribution the harder route
GreptimeDB deserves a trial when separate metrics and log stores have become an operational burden and SQL across telemetry is useful. The published standalone image is the sensible first contact; our two 900-second timeouts make a source checkout a poor way to answer a basic product question. For contributors, allocate more CPU time and follow the project's split test commands before judging the tree.
VictoriaMetrics is the narrower option for a metrics-first estate. ClickHouse gives a general analytics engine but leaves more observability assembly to the operator. OpenObserve puts a larger application surface, including search and dashboards, around the telemetry store. GreptimeDB sits between those choices: database-first, multi-signal, and explicit about the manual work that remains in its open-source edition.