It is a focused time-series store, not an observability bundle
VictoriaMetrics stores and queries the timestamped values behind infrastructure dashboards, Kubernetes monitoring, IoT fleets, and industrial telemetry. Its useful proposition is to preserve Prometheus-compatible workflows while adding a purpose-built long-term store. The project has 17,640 GitHub stars, an Apache-2.0 license, and a v1.151.0 release dated August 31, 2026.
The open-source offering comes in 2 deployment shapes. A single-node edition targets a simpler footprint, while a cluster edition serves capacity or availability requirements that demand distribution. Both are open source, rather than limited agents for a closed backend. Enterprise and LTS releases add commercial support and features for organizations that need them.
What happened when we ran it
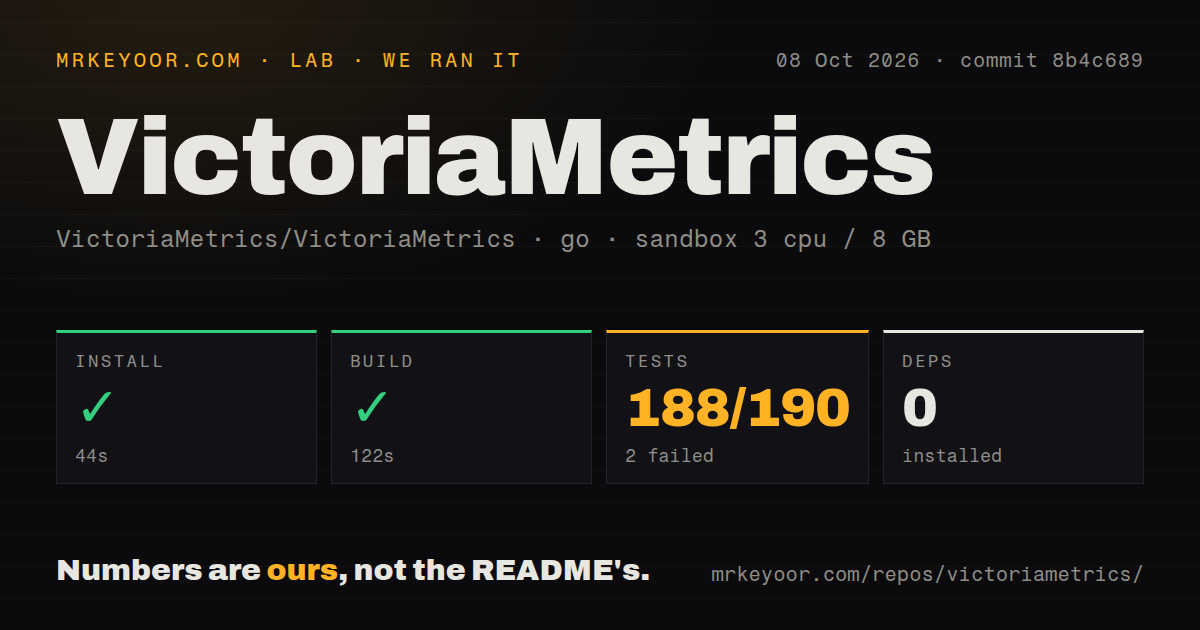
Our install phase succeeded in 62 seconds inside a fresh, unprivileged Debian container using Go 1.24, and installed 0 packages. The build succeeded in 105 seconds. That supports the README's no-dependencies, small-binary pitch for compilation of commit 0e74caf, although it does not prove production setup is equally simple.
The test step was not clean. It ran for 159 seconds, with 188 passing and 2 failing out of 190. The log shows many libraries completing, including storage in 68.915 seconds and uint64set in 6.349 seconds, before a bare FAIL. It does not identify the 2 failures or their causes, so blaming either the code or container would be speculation.
We measured 2,365 files, roughly 304,094 lines of source, and a 69 MB checkout. The repository contained 8 CI workflows, no Dockerfile, and no separate tests directory. The last point does not mean tests are absent, as the Go run produced 190 results, but contributors should expect package-local tests rather than one top-level folder.
Protocol coverage is the practical advantage
The README presents at least 10 ingestion paths: Prometheus scraping and remote write, InfluxDB line protocol, Graphite, OpenTSDB, JSON lines, CSV, a native format, DataDog or DogStatsD, New Relic, and OpenTelemetry. This range can reduce translation services when a company has accumulated telemetry from several generations of tooling.
There are also 2 query choices: PromQL for compatibility and MetricsQL as the project's more performance-oriented language. A global query view can combine data from multiple Prometheus instances or other sources. Stream aggregation, metrics relabeling, and a cardinality limiter help control data before excessive label growth becomes an operational problem.
The operational story includes a small binary, command-line configuration, instant snapshots, and NFS-backed storage such as Amazon EFS and Google Filestore. Published images on 2 registries, Docker Hub and Quay, offer an easier route than compiling. These conveniences still need testing against the selected single-node or cluster topology.
The rough edges begin after the easy build
The failed suite is the clearest caution. A 105-second successful build says the source compiles on our box, but a 159-second run ending with 2 failures leaves evaluation unfinished. Capture the complete failing output and rerun those exact tests before treating this checkout as a production candidate.
Our snapshot had no Dockerfile even though official container images are advertised. That may matter to teams requiring a source-visible local container build. At 304,094 source lines and 780 open issues, this is a serious platform with a large surface area, not software whose cluster mode should be operated casually.
Some capabilities are reserved for Enterprise, with anomaly detection named in the README excerpt. Teams should map requirements against the open-source and paid editions before committing to v1.151.0. The documentation covers concepts, quick starts, integrations, changelogs, upgrades, security, LTS releases, and support, but documentation cannot replace a restore rehearsal.
Current activity is strong, while issue load needs triage
The health signals show active maintenance. Version v1.151.0 arrived on August 31, 2026, and the repository was pushed again on September 2. There are 8 CI workflows and 17,640 stars, plus public Slack, Reddit, X, and YouTube channels. Together, these signals say more than popularity alone.
The counterweight is 780 open issues. A large user base can create a large queue, so this is not proof of neglect beside a release only 2 days old and a push today. Adopters should inspect issues relevant to their protocols, storage, and upgrade path instead of assuming project-wide activity settles every edge case.
It fits behind collectors and in front of Grafana
Prometheus instances, OpenTelemetry components, or vendor agents can send metrics into VictoriaMetrics, while Grafana queries the consolidated store. The single-node edition is the sensible first evaluation for 1 team or contained workload. Cluster mode becomes reasonable only when retention, volume, tenancy, or availability justifies extra moving parts and a recovery plan.
Prometheus remains simpler when scraping and shorter local retention suffice. Thanos fits teams extending Prometheus with sidecars and object storage, while Grafana Mimir targets horizontally scalable, multi-tenant Prometheus storage. InfluxDB suits teams aligned with its separate ecosystem. These 4 alternatives differ architecturally, so compatibility should narrow the field before performance trials.
The evidence supports a trial, not a blind rollout
VictoriaMetrics combines broad protocol support, 2 open-source deployment modes, active maintenance, and a credible role as long-term Prometheus storage. Our run built successfully and passed 188 of 190 tests, which is promising but not a release gate. Trial representative cardinality, retention, restore, and query workloads, then proceed only after the 2 failures are understood.