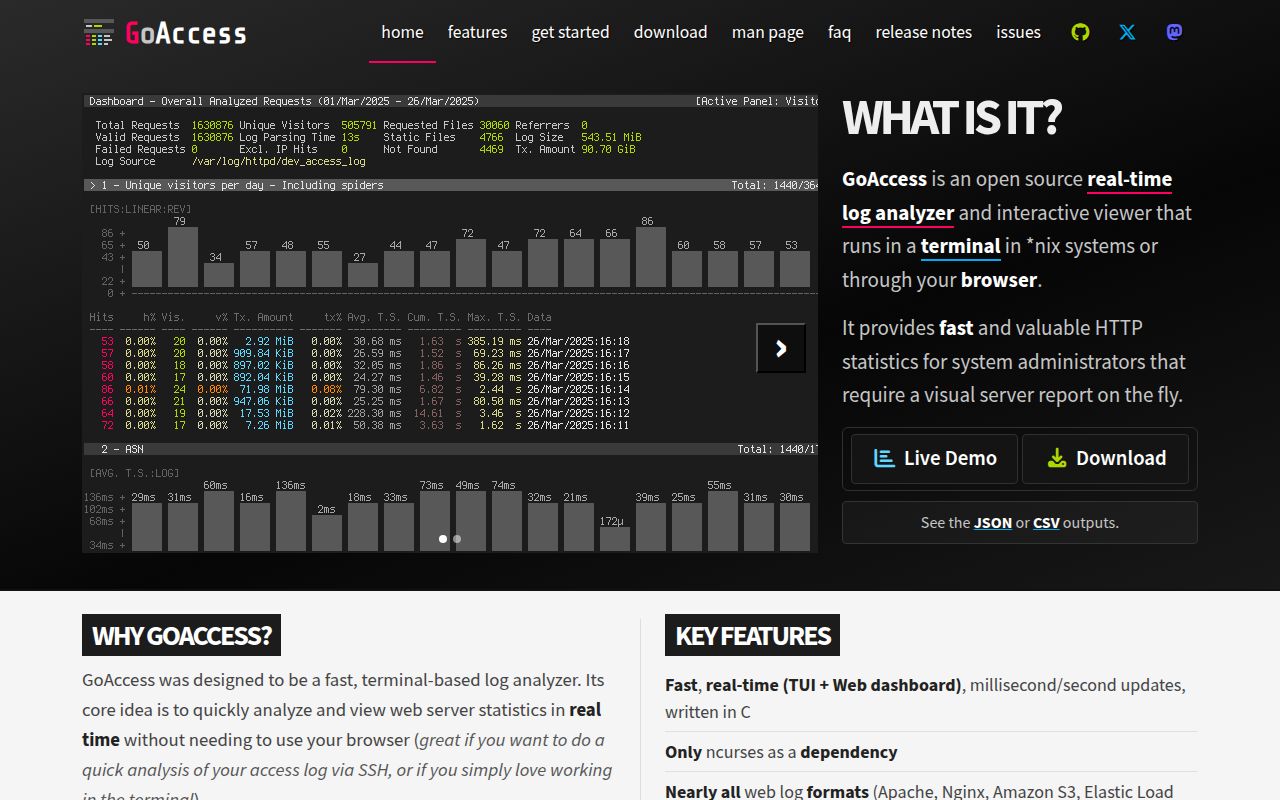
GoAccess suits administrators who want terminal or HTML traffic reports directly from web server logs. Choose it for questions about requests reaching your infrastructure. Choose a query-oriented dashboard when you need to keep changing the question across several traffic dimensions. Our source-install attempt stopped at a missing executable, and the separate deployment attempt stopped before a dashboard could be exercised.
This review covers allinurl/goaccess, the open-source log analyzer at goaccess.io. It does not cover the similarly named community-access apps. The useful distinction is between understanding server traffic and counting an audience: GoAccess can help with the first without proving the second.
What people use GoAccess for
People have used GoAccess to inspect CloudFront traffic, allocate shared infrastructure usage, and run personal-site analytics from logs. These accounts describe actual workflows, with enough detail to see whether the same approach fits your server.
| Who used it | What they did | What came out |
|---|---|---|
| The author of DIY Analytics with GoAccess | Generated separate CloudFront reports for all traffic and cache misses | The cache-miss subset helped examine caching rules; filtering happened before report generation. |
| The same serialized.net author, working with a customer | Extracted JSON from shared CloudFront and ELB logs | Per-virtual-host hits and bandwidth supported internal rebilling. |
| Ben Hoyt | Connected GitHub Pages to CloudFront pixel logs, a Python converter and GoAccess | His custom analytics worked well enough; he later switched to GoatCounter for simplicity and its creator's privacy approach. |
| Chris Wiegman | Used anonymized Nginx logs on his personal and code sites | He reported satisfactory operation with little extra server load, after several days of setup troubleshooting. |
The cache example is the clearest reason to try GoAccess. A report limited to cache misses answers a narrower operational question than an overall traffic total. The author filtered the input with grep and generated another report. That workflow is worth understanding before expecting every investigation to happen inside the dashboard.
Hoyt's setup shows the opposite tradeoff. A static site without the desired server logs needed a pixel endpoint and a converter before GoAccess could do its part. His later switch was a preference for a simpler arrangement, not a report that GoAccess had failed. Start by finding out which logs your host actually lets you retrieve.
What happened when we ran it
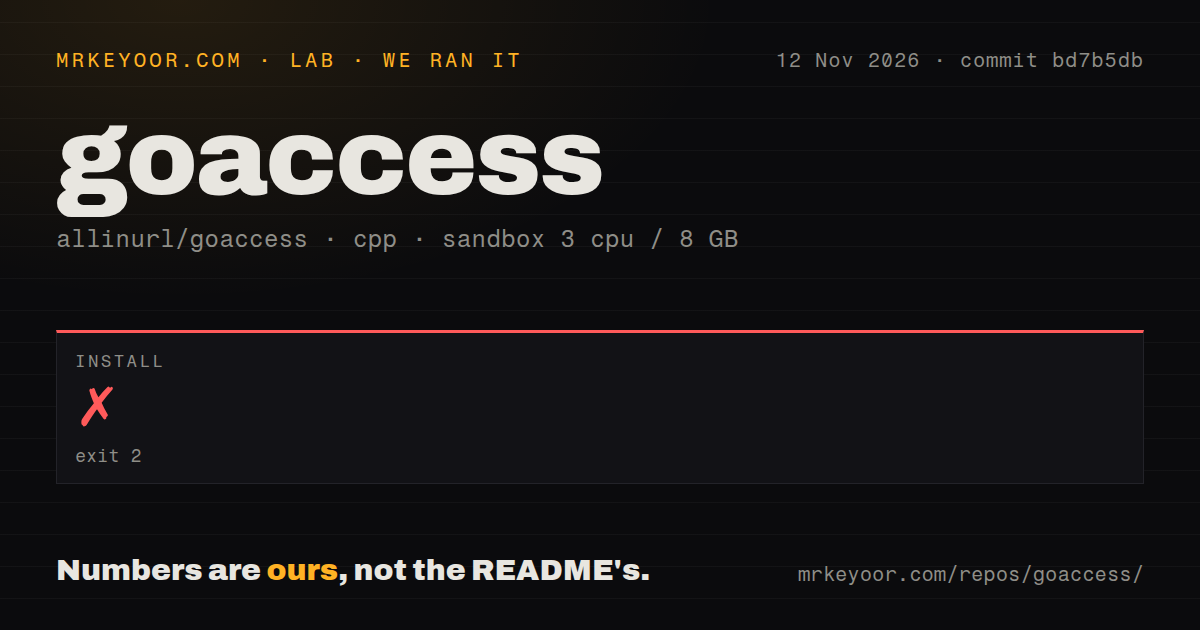
Our GoAccess install failed with exit 2 after 1 second in the November 12, 2026 sandbox run at commit bd7b5db. A separate Docker lab attempt stopped at its Compose-file safety check. The step records, rather than the deployment label, determine what we can say happened.
| Recorded check | Result | What it means |
|---|---|---|
| Source install | Failed, exit 2, 1 second | The log says it could not execute autopoint and autoreconf stopped. |
| Sandbox configuration | 3 CPUs, 8 GB RAM, image lab-cpp:1 | These are recorded settings; the image name supplies no actual runtime or operating-system version. |
| Repository scan | 156 files, about 52,197 source lines, 4 MB checked out | This describes the checkout, not the installed footprint. |
| Repository signals | 5 CI workflow files, Dockerfile present, no tests directory found | File discovery is separate from running checks. |
| Docker lab safety step | Failed because none of the required Compose filenames existed at the checked location | The automation required a Compose file before proceeding. |
| Docker lab teardown | OK | Cleanup was recorded after the blocked attempt. |
Our measurement setup separates the source-install sandbox from the Docker lab automation. The sandbox records describe a checkout and an attempted installation; the deployment step describes a safety check before proceeding. Neither record contains a completed dashboard task. Keeping those boundaries separate prevents a failed prerequisite from becoming a claim about report accuracy.
The source log ends with Can't exec "autopoint": No such file or directory and autoreconf: error: autopoint failed with exit status: 2. That is a specific setup failure. It does not tell us which operating-system package was absent, whether another installation route would succeed, or whether the analyzer would handle our logs correctly.
The current README distinguishes a Git checkout, which starts with autoreconf, from a release archive and distribution packages. Our failure belongs to the recorded source-install path. Treating that result as a broken traffic analyzer would overstate it. Treating the README's short commands as a completed installation would make the opposite mistake.
The Docker run record describes deployment with the project's own Docker Compose and loopback-bound ports. But the actual safety step says no compose.yaml, compose.yml, docker-compose.yaml or docker-compose.yml existed. This attempt was blocked, not a demonstrated deployment. The teardown record says cleanup was OK. A README link to Compose documentation does not change that recorded outcome.
Where people get stuck: log formats and live-report plumbing
The recurring setup errors in the supplied issues concern matching log fields and connecting a browser to the generated report. Read the exact symptom before changing ports or rewriting the logging pipeline.
| Symptom and source | What the thread shows | Resolution in the supplied record |
|---|---|---|
| Issue #1635: tokens fail to match %h | Leading whitespace and different field layouts require matching custom formats | Maintainer allinurl supplied revised formats; librenauta confirmed one worked. Closed. |
| Issue #969: HTTP returns 400 Invalid Request | The user requested the WebSocket port as if it served the dashboard | The maintainer explained separate HTML serving; thornyweb shared an Nginx plus GoAccess Compose setup working locally. Closed. |
| Issue #737: live HTML stays static | The browser could not reach the intended WebSocket endpoint; another participant hit mixed content | sajjadalis confirmed an explicit public-IP ws-url worked. The HTTPS case exposed a separate transport mismatch. Closed. |
| Issue #117: filter the dataset inside the UI | Readers ask for field, regex and date filtering across reports | The maintainer recommends filtering source logs with external tools. The supplied record is open. |
Issue #969 is an easy mistake to make. The container reported that its WebSocket server was ready, so the reporter opened that port with HTTP. It returned 400. Generating a page and serving a page are separate operations here. The working arrangement exposed the HTML through Nginx and kept the WebSocket connection for live updates.
For GoAccess Docker use, plan the log input, the report output, and the browser's update connection separately. A mounted report directory gives a web server somewhere to read the generated file. The browser also needs a reachable WebSocket address with transport compatible with the page. Merely exposing a container port does not complete either arrangement.
Issue #1635 deserves the same patience. A complaint about an IP-address specifier can start with whitespace or a field-layout mismatch. Compare a real log line with the selected format. Copying a custom format from another person's reverse proxy without comparing the fields can simply move the error elsewhere.
Hits and visitors answer different questions
A GoAccess visitor is a grouping of log records, not an authenticated person. The official manual defines a unique visitor using the same IP address, date and user agent; it also documents finer date specificity options. Hits count requests. Neither label by itself supplies a verified human audience.
In the r/selfhosted visitor-count thread, ZebraSoft8624 questioned whether their apparent audience included bots. Respondent petdarrow suggested ignoring common crawlers and checking referring-site counts. That is useful investigation advice, but the response itself acknowledges difficulty separating humans and bots precisely.
For an operator, bot traffic still matters: those requests reach the server and can consume bandwidth. For a publisher deciding whether people read an article, the same total needs a different interpretation. Keep the metric's definition beside the number rather than calling every visitor a reader.
The current repository documents separate AI-crawler and Fediverse categories as well as UTM campaign reporting. Those are useful distinctions in the product's stated reporting scope. Categorizing recognizable traffic does not turn a user-agent-based grouping into proof of identity, and a campaign parameter in a requested URL does not show what the person did after the request.
Persistence can count a rebuilt file again
Recreating an already processed input file can make persisted analysis count its requests again. Issue #1945 documents a preprocessing workflow that concatenated, sorted and rewrote logs before feeding them back into GoAccess.
The reporter repeated the same processing and saw totals double. Maintainer allinurl explained that GoAccess checks the inode: a new file is treated as new input. The proposed workaround was to pipe transformed data directly into GoAccess instead of repeatedly regenerating a named input file.
That matters if your automation strips variable IDs from URLs or rebuilds a monthly log on every scheduled run. Request timestamps alone are not a sufficient mental model for deciding whether the input will be processed again. Preserve a small known dataset and compare counts when the pipeline repeats it before trusting accumulated reports.
The same thread later records an undercount after switching to a pipe. A participant suggested retention settings, but the reporter said the selected retention period should include the data. The issue is closed, yet the supplied conversation ends without a confirmed explanation for that later symptom. A closed label cannot supply a successful outcome missing from the discussion.
Volume reports are warnings, not a capacity rating
The evidence contains both satisfied high-volume users and a historical counter-overflow report. In the reverse-proxy discussion, petdarrow described good operation at their office. In issue #1988, 0bi-w6n-K3nobi reported overflow across totals and several panels while processing a month across multiple sites.
The latter thread discusses wider counters and possible storage changes. The supplied record remains open and contains maintainer discussion rather than confirmation of a shipped correction. It is a reason to check totals against known inputs for a large workload, not a defensible current capacity ceiling.
The README describes in-memory hash tables and on-disk persistence. Saving analysis data to disk should not be read as a promise that every dataset can be processed with bounded memory. Choose a representative retention period and URL variety for an evaluation: a site with many distinct request paths presents a different input from repeatedly requesting a few pages.
Privacy requires protecting the logs and the report
Reading existing access logs can avoid adding a tracking script, while leaving you responsible for the information those logs and generated reports expose. Wiegman's account explicitly combines anonymized logs, daily deletion and restricted report access. His privacy outcome came from that arrangement, not merely from installing GoAccess.
The official getting-started guide tells operators to consider restricting access to the generated page. That is practical advice for a dashboard you place under an existing web root. Decide who should see the report before making the file reachable, especially when your log format includes client addresses or detailed request URLs.
The current README also documents local and external JWT verification for WebSocket authentication, token refresh, and closing connections when verified tokens expire. Treat the live connection and the HTML page as separate access-control tasks. A protected update stream does not by itself restrict access to a static file served elsewhere.
GoAccess vs AWStats, Grafana and other analytics
Choose GoAccess for reports from a defined set of access logs; investigate Grafana with Loki when the job requires changing queries across traffic dimensions. In the reverse-proxy discussion, ElsaFennan wanted status code, virtual host and geography correlated in one view. Replies recommended Grafana with Loki and described the extra setup work.
| Choice | Evidence behind the comparison | Pick it when |
|---|---|---|
| GoAccess | The serialized.net workflow filters logs before producing focused reports | You have the logs and can define the subset you want to inspect. |
| Grafana with Loki | Torrew recommends complex queries and custom dashboards in the reverse-proxy thread, while calling setup nontrivial | Repeated multidimensional investigation justifies owning a collection and query stack. |
| GoatCounter | Hoyt's update explains his switch from a working custom GoAccess arrangement | His preference for a simpler analytics arrangement matches your priorities. |
| Fathom Analytics | Wiegman calls his GoAccess arrangement less complete but sufficient for noncommercial blogs | Evaluate it if the broader website-analytics job matters more than his preference to avoid another subscription. |
| AWStats | Readers mention reporting periods and referrer questions in issue #117 and the Hacker News discussion | Compare your required report directly rather than inferring a winner from those mentions. |
Our Grafana review and Loki review cover the separate tools. The supplied community recommendation names Promtail too. Treat that as the historical stack proposed in the discussion, rather than a current installation prescription.
GoAccess vs AWStats is a reporting-workflow comparison in these records, not a measured contest. GoAccess vs Grafana is more consequential for this decision: generating a report from a subset and repeatedly querying an evolving dataset ask different things of the operator. Choose the workflow you will actually maintain.
What the other reviews get wrong
Several older guides omit configuration boundaries or describe historical packaging as if it were today's product. Their examples can still be useful if you keep their dates and scope attached.
João Granja's Quick Tips article says GoAccess works without any configuration, although its own usage section also says to determine the log format. The official guide makes that prerequisite explicit. Issue #1635 shows why the distinction matters when the default layout does not match your logs.
Wiegman's 2019 guide says the normal package cannot save reports to disk and directs readers to goaccess-tcd. The current repository documents on-disk persistence, while the official guide shows ordinary HTML report output. Keep those two operations separate: writing a report file and retaining analysis data are different requirements. Do not transplant the old package advice into a new deployment without checking the selected package's capabilities.
LibHunt reproduces wording that makes the real-time HTML flag sound sufficient. Issue #969 and the official guide supply the missing piece: GoAccess does not serve the HTML page itself. Issue #737 adds the browser's WebSocket reachability and transport requirements.
Arnaud Rebillout's detailed tutorial covers GoAccess 1.4 in 2020. That version label belongs to the historical tutorial. The current repository's release-archive example uses 1.12. Use the tutorial for explanations, and the selected release's documentation for commands and options.
Questions people ask
The main questions concern product identity, Docker output and the meaning of traffic counts. Start with the log analyzer's actual repository rather than a similarly named login page.
What is the GoAccess log analyzer, and who is it best suited to?
GoAccess reads web server logs and produces terminal or browser reports for administrators. The GoAccess GitHub repository is allinurl/goaccess, and its official site is goaccess.io. Its English README and getting-started guide provide an entry point for operators who can access their logs.
Is the GoAccess resident login or mobile app related to allinurl/goaccess?
The resident GoAccess app describes HOA visitor management and points to GoAccess.com; it is a different product from the analyzer at goaccess.io. Searches for GoAccess login, GoAccess app, goaccessacloud or GoAccess careers should not be treated as log-analyzer evidence. The supplied records identify neither goaccessacloud nor a careers destination for this repository. The supplied GoAccess Indigo results include IndiGo airline and IndyGo transit pages, also unrelated to this analyzer.
How do I run GoAccess in Docker and view its HTML report?
Use the upstream Docker instructions for input and output paths, then open the generated HTML locally or serve it through a separate web server. Live updates also need the browser to reach the WebSocket endpoint. Issue #969 explains why visiting the WebSocket port with HTTP can return 400 instead of a dashboard.
How does GoAccess compare with AWStats?
The supplied discussions raise AWStats around reporting periods and attribution questions. They support those evaluation criteria, rather than a claim that either tool solves them better. Bring a concrete report requirement to the comparison.
When should I choose GoAccess over Grafana with Loki?
Choose GoAccess when a report over available access logs answers the question. Consider the community's Grafana-with-Loki recommendation when you need complex queries and custom correlations often enough to justify the additional operating work.
How does GoAccess compare with Webalizer?
Webalizer appears in the supplied search intents, but the research contains no substantive evaluation against GoAccess. There is no supported comparative winner here.
How does GoAccess compare with Matomo?
The supplied alternatives directory lists Matomo, but a directory listing cannot establish which tool fits your reporting needs. This review offers no feature-by-feature or measured Matomo verdict.
What is the difference between hits and visitors in GoAccess?
Hits count requests. The manual groups unique visitors by IP address, date and user agent, with date specificity options. A visitor total can include bots, so it should not be presented as a count of verified people.
What we have not tested yet
We have not tested a functioning GoAccess dashboard in our lab: the source attempt stopped at autopoint, and the deployment attempt stopped at the Compose-file check. The pack contains no successful task answers or screenshots. There are no measured runtime versions, completed build or test results, throughput figures, or installed-memory figures to report.
Our next useful checks would use known log inputs to test parsing, visitor grouping, repeated persistence imports and log rotation. They would also exercise authenticated WebSocket access through HTTPS and check that a protected report stays private. Current UTM reporting and crawler categories need direct evaluation alongside those tasks.
The later undercount in issue #1945, the current status of the historical counter behavior, and HTML regeneration from archived report JSON need separate evidence. The Reddit JSON-archive reply speculates from raw-log processing rather than demonstrating report-JSON reimport. We have not tested that route and would retain the original logs until a recovery procedure has been demonstrated.
No side-by-side alternatives benchmark or legal-compliance assessment underlies this review. Community outcomes are attributed reports, not our measurements. GitHub attention and activity cannot tell us how many production installations exist. All four rating dimensions are unassessed because this evidence does not support a consistent numerical judgment of setup, documentation quality, community support or production maturity. For the first evaluation, keep the raw input and an expected request count: a dashboard is easier to trust when you can explain where its total came from.