Loki saves index cost by indexing labels, not log text
Loki's defining decision is simple: it indexes metadata labels for each stream, while storing compressed log lines without a full-text index. That can cut the indexing work behind high-volume logging, especially when the questions start with a service, namespace, pod, or environment. The trade is equally direct. Queries that begin with well-chosen labels fit the system; open-ended search across arbitrary message text does not receive the same index structure as Elasticsearch or OpenSearch.
The codebase is substantial. Our checkout contained 4,324 files, about 802,947 source lines, and 94.6 MB at commit 8c75a64. Loki can run as one binary for a local trial, but its normal stack has 3 named parts: Grafana Alloy gathers and sends logs, Loki stores and queries them, and Grafana displays them. Promtail is feature complete, and the README directs future collection work toward Alloy.
Kubernetes labels make Loki useful and dangerous
Kubernetes is the clearest fit because pod metadata already supplies labels that operators use during incidents. Loki shares the label-oriented mental model of Prometheus, which makes moving between a metric spike and the relevant log streams feel natural in Grafana. LogQL and LogCLI give teams interactive and command-line query paths, while Loki Canary checks whether expected logs disappear from an installation.
Labels also need discipline. The 36 CI workflow files in the repository are evidence of a heavily maintained system, not a substitute for a stream design. If teams promote highly variable values into labels, the number of streams grows and the storage model loses its advantage. Service names, environments, clusters, and bounded workload identities are sensible dimensions. Request IDs and other near-unique values usually belong in the log line for filtering after the stream selector.
What happened when we ran it
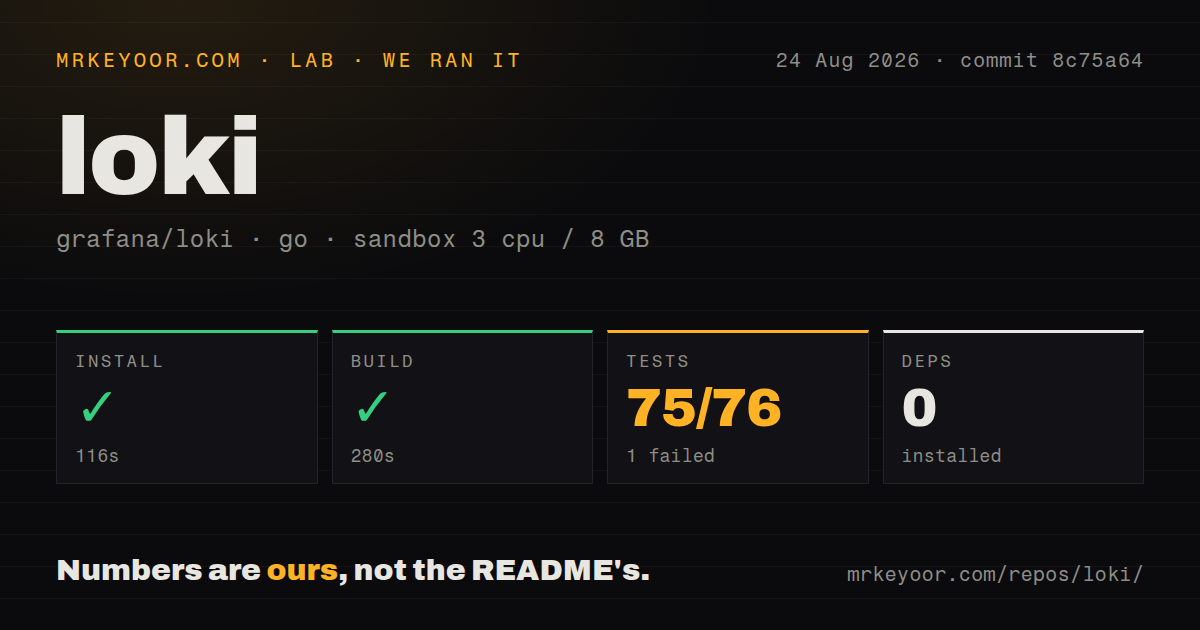
Our Go install completed in 116 seconds and reported 0 packages installed. The build then succeeded in 280 seconds inside an unprivileged golang:1.24-bookworm container with 3 CPUs and 8 GB of RAM. Those results show that the source tree can compile in a plain Go environment, though a 280-second build is long enough to matter for clean CI jobs and contributor feedback.
Tests did not complete within our 900-second limit. The command reported 75 packages passing and 1 failing out of 76 before timing out. The log tail showed successful storage packages, several packages with no test files, and timings for bloom shipper and index shipper packages. It did not include the failing assertion, so we cannot say whether the failure came from the container, the repository, or an earlier package.
The checkout had no root Dockerfile and no top-level tests directory, although it had 36 workflow files. That layout is not a quality problem by itself, but it means a contributor should follow repository commands rather than infer a generic docker build or look only for one tests folder. Our sandbox had no secrets and no privileged access. Install and build passed under those limits; only the full test run exceeded the available window.
One local binary becomes a distributed service in production
The source README offers a credible local path: compile ./cmd/loki, launch it with the supplied local YAML configuration, then push and query logs. No database credential is needed for that experiment. Multi-tenant operation changes the setup. Authentication must be enabled, requests need tenant context, and runtime configuration can carry tenant-specific overrides. The surrounding Alloy and Grafana services must also be installed and connected.
The 900-second test timeout is a useful warning about operational scope. A production deployment needs decisions about object storage, retention, ingestion capacity, query capacity, label policy, tenant isolation, and upgrades. Loki may be easier to operate than a full-text search cluster for the right log model, but it is still a distributed stateful system. The single-binary mode helps evaluation and smaller workloads; it does not erase capacity planning.
AGPL and chart ownership need an explicit decision
Loki uses AGPL-3.0-only, with Apache 2.0 exceptions documented separately. That license can be acceptable for internal infrastructure, but organizations with strict distribution or hosted-service policies should involve counsel before standardizing on it. This is a purchasing constraint, not a minor footer detail, because a logging platform tends to become shared infrastructure with a long replacement cycle.
The deployment path also changed on March 16, 2026. The README says the Grafana Loki Helm chart moved to grafana-community/helm-charts; the chart remaining in the Loki repository is maintained for Grafana Enterprise Logs users. Existing automation should pin the intended chart source and document who owns upgrade testing. Copying an old install command into a new cluster can otherwise put a team on the wrong maintenance track.
Current releases and issue activity support long-term use
Loki was pushed on August 26, 2026, and v3.7.6 was published on August 6. GitHub showed 1,715 open issues and pull requests together. Recent issue activity included a multi-tenant detected-labels failure and a ruler query-frontend message-size configuration mismatch. The latest release fixed query-range handling of a label sketch. These dated signals show ongoing maintenance alongside a large public queue.
Our 280-second build and unfinished 900-second test run keep Loki from being an effortless source dependency. As an operated product, it makes sense for teams already invested in Grafana, Prometheus-style labels, and Kubernetes metadata. If your investigators need arbitrary full-text search first, pick Elasticsearch or OpenSearch. If your streams have stable labels and index cost is the pain, Loki's narrower indexing model is a sound reason to accept the operational work.