It gives agents DevTools evidence instead of page guesses
Chrome DevTools MCP connects a coding agent to a live Chrome instance. The agent can navigate, click, type, inspect console messages, review network requests, capture screenshots, and record performance traces. Release v1.8.0 also includes PWA automation and expanded heap-snapshot tools. A standalone CLI offers the same general tool surface without requiring an MCP client.
This is most useful after a bug reaches the browser. Source inspection may suggest why a page is slow or broken, but a console exception, failed request, DOM state, or trace can settle the question. Puppeteer performs browser actions and waits for their outcomes, while DevTools supplies diagnostics that ordinary screenshot-only automation lacks.
The connected browser becomes part of the agent's trust boundary
The README gives a direct warning: MCP clients can inspect, debug, and modify any data in the browser instance. That includes pages, storage, authenticated sessions, and whatever the user has opened. Connecting a daily personal profile would place far more information in scope than most debugging tasks require.
Use a separate Chrome profile with only the target application and test accounts. Scope the MCP server to the workspace or client that needs it, and close the browser when the task ends. Performance tools may send trace URLs to Google's CrUX API unless --no-performance-crux is set. Usage statistics are enabled by default and need their own command flag or environment variable to disable; changing Chrome metrics does not change this server's setting.
What happened when we ran it
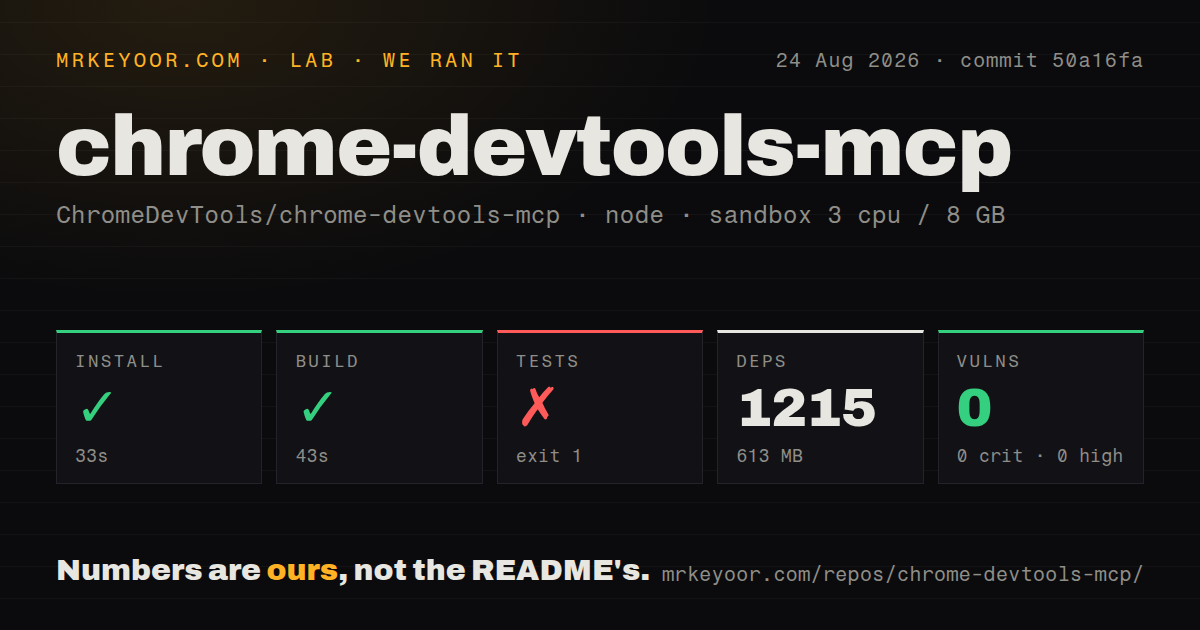
Our sandbox installed 1,215 npm packages in 33 seconds and used 613 MB on disk. The build succeeded in 43 seconds. Npm audit reported 0 known vulnerabilities across critical, high, moderate, and low severities. The source checkout at commit 50a16fa measured 1,541.4 MB before installation, with 114,840 files and about 12,108,227 source lines.
Tests exited with code 1 after 108 seconds. The supplied log tail showed a failure passing through Puppeteer's raw CDP send, TargetManager initialization, CdpBrowser attachment and creation, and ChromeLauncher. It then printed a failing-tests summary. The tail did not include the originating error message or a final test count, so it supports a browser-connection failure path but not a specific cause.
The same tail showed telemetry buffer tests passing immediately before the failure summary. Our fresh environment was an unprivileged Debian container with Node 22, 3 CPUs, 8 GB of RAM, and no secrets. A failed browser launch or attachment in that setting is a concrete compatibility finding. It does not establish whether a desktop Chrome session, a different container policy, or upstream CI would behave the same way.
One npx line hides a required Chrome installation
The usual MCP configuration runs npx -y chrome-devtools-mcp@latest. A slim mode narrows the available browser tools and can run headless. The README lists configurations for Claude Code, Codex, Gemini CLI, Cursor, Copilot, JetBrains tools, and many other clients. Claude Code users can install an MCP-only command or a plugin that also carries skills.
The server still needs Node.js LTS, npm, and current stable Chrome or newer. Only Google Chrome and Chrome for Testing receive official support. Other Chromium-based browsers may work, but the project explicitly declines a guarantee. Existing-browser modes require the browser to be running and reachable at the configured debugging address; the Antigravity example uses port 9222 and does not launch that browser itself.
DevTools depth separates it from generic browser control
A basic browser agent can fill forms and capture pages. Chrome DevTools MCP goes further into performance and debugging. It can collect source-mapped console stacks, inspect requests, produce DevTools performance insights, and query heap snapshots. v1.8.0 added retained-size reporting, context-retention detail, human-readable size ranges, and PWA tools. Those features suit memory leaks and performance regressions that visual automation cannot explain.
That depth also increases response size and operational complexity. Heap snapshots and traces can be large, browser state can change between calls, and an agent may choose an expensive tool when a small DOM query would suffice. Slim mode is a sensible default for routine page interaction. Enable memory or performance features for a named investigation, then review what data leaves the browser.
Updates and telemetry need explicit policy choices
The server periodically checks npm for a newer version and logs a notice. Teams that pin dependencies or run restricted CI can disable those checks through CHROME_DEVTOOLS_MCP_NO_UPDATE_CHECKS. Usage statistics include tool success rates, latency, and environment information. They can be disabled with a flag, CHROME_DEVTOOLS_MCP_NO_USAGE_STATISTICS, or the CI environment variable.
These settings should be part of the checked configuration rather than an instruction that every developer remembers. Pinning @latest is convenient for a personal trial, but managed workflows should choose a reviewed version. The project has no Dockerfile in the measured checkout, so teams responsible for CI browser parity must define their own Chrome image and sandbox rules.
v1.8.0 is active, while local browser parity still needs proof
GitHub recorded 49,773 stars, 95 combined issues and pull requests, and a push on August 26, 2026. Release v1.8.0 arrived on August 25 with PWA, heap, page-routing, upload, CLI, and browser-action changes. This is current software with frequent work, not an abandoned adapter.
The 33-second install and clean npm audit make the package easy to trial. Our failed 108-second suite says source contributors and CI owners need one more step: reproduce Chrome launch and attachment under the same isolation they plan to use. If that works, the tool offers unusually direct evidence for browser debugging. If cross-browser testing is the goal, Playwright MCP is the more natural comparison.