tensorboard review
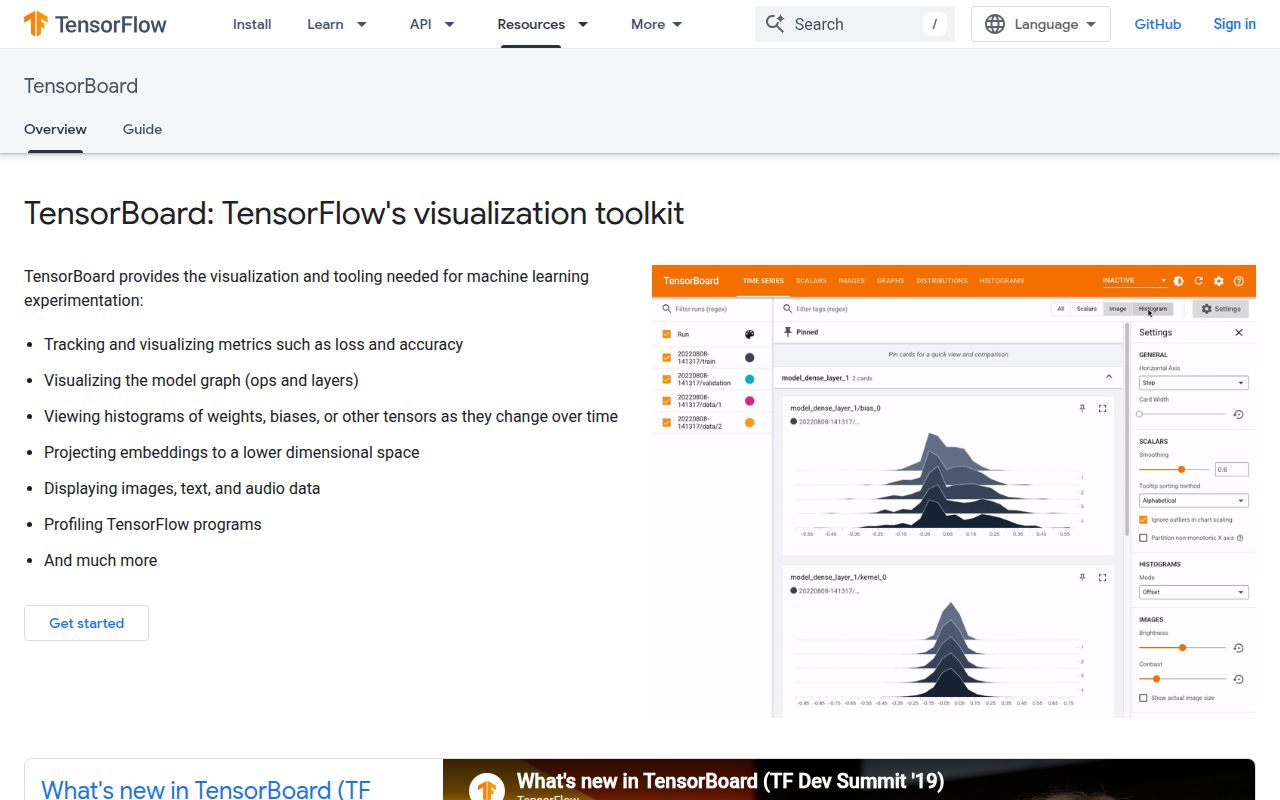
TensorBoard 2.21.0 is a local web application that reads `tfevents` files and charts machine-learning scalars, histograms, images, audio, text, graphs, profiles, and embeddings. TensorFlow and Keras write its format directly, and PyTorch includes a compatible SummaryWriter. The 2.21 release limits time-series tooltips to 5 items, defaults their order to the nearest pixel, fixes a Projector plugin vulnerability, and replaces a `pkg_resources` dependency that caused startup crashes. Our standalone install used 130 MB.
TensorBoard 2.21.0 installed in 4.7 seconds as 13 packages using 130 MB, imported in 0.04 seconds, and had 0 audit findings in our sandbox. Run it for offline charts, graphs, profiles, and embeddings; choose a tracking platform once authentication, artifacts, and team search matter.
We installed it
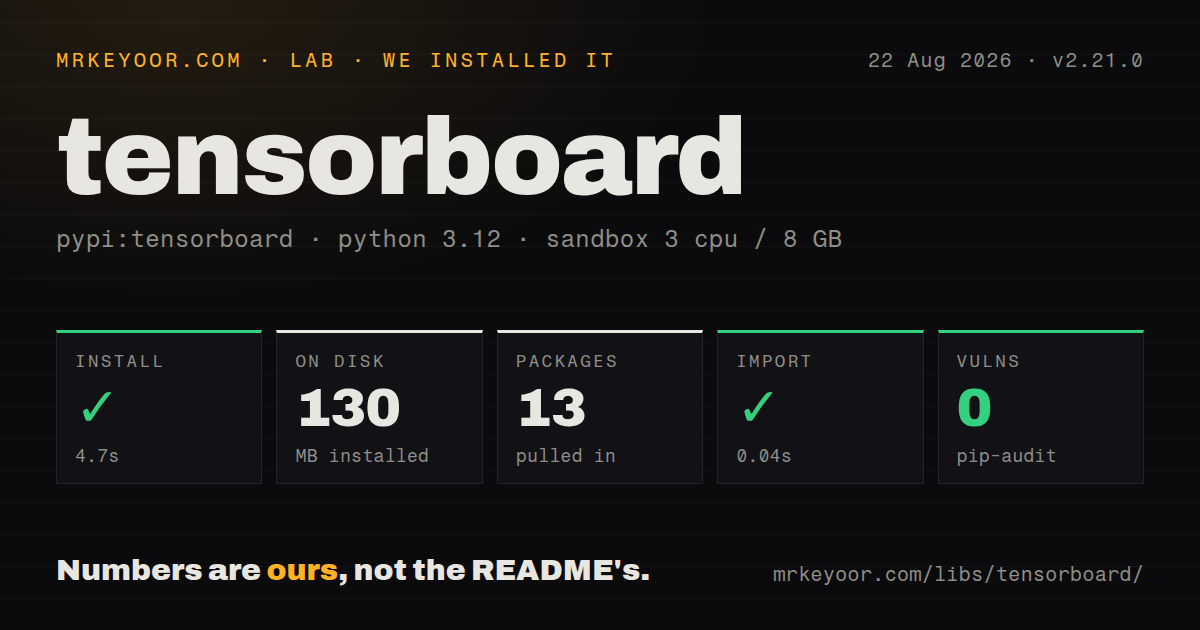
| Install | ✓ · 4.7s | 13 packages on disk · 130 MB |
| Import | ✓ | import tensorboard in 0.04s · pure Python · requires Python >=3.9 |
| Known vulns | 0 | (pip-audit) |
Answers from our run
Does tensorboard install cleanly?
Yes. In a fresh container with an empty cache, pip install tensorboard finished in 5 seconds, leaving 13 packages and 130 MB on disk. pip-audit reported no known vulnerabilities.
What does tensorboard need to run?
Python >=3.9, and nothing compiled: it is pure Python. In our run import tensorboard succeeded in 0.04s.
tensorboard or tensorboardX: which should you use?
tensorboardX: Use it when non-TensorFlow training code only needs to write TensorBoard-compatible event files. TensorBoard 2.21.0 installed in 4.7 seconds as 13 packages using 130 MB, imported in 0.04 seconds, and had 0 audit findings in our sandbox.
When should you not use tensorboard?
A team needs authenticated shared projects, searchable run metadata, artifact lineage, comments, or a model registry. TensorBoard reads event files rather than managing that workflow.
Use it if
- You need an offline dashboard for TensorFlow, Keras, or PyTorch runs without creating an account or deploying a tracking server.
- Separate run directories should appear together for visual comparison of losses, metrics, distributions, images, or text.
- The TensorFlow graph, profiler, or embedding Projector views are part of the debugging workflow.
- Existing training code already writes summaries and a browser at localhost:6006 is enough for the people reviewing them.
- A team needs authenticated shared projects, searchable run metadata, artifact lineage, comments, or a model registry. TensorBoard reads event files rather than managing that workflow.
- The dashboard is a production dependency and 130 MB on disk is too much for local visualization that can run in a separate environment.
- Several distributed workers write event files into one run directory. The README says TensorBoard expects one active writer unless you accept the experimental multifile reload path.
- Every recorded point must remain visible. TensorBoard uses reservoir sampling in memory and `--samples_per_plugin` sets retention by plugin.
- Your Python integration requires a typed package contract. Version 2.21.0 does not ship `py.typed`, even though the command and event format are widely used.
Setup reality
We installed tensorboard 2.21.0 in a fresh Python 3.12 Bookworm sandbox. pip completed in 4.7 seconds, left 13 packages, and used 130 MB on disk. The pure-Python distribution declares 10 direct dependencies, requires Python 3.9 or newer, and uses Apache 2.0. It does not ship py.typed. import tensorboard worked in 0.04 seconds, and pip-audit found 0 known vulnerabilities.
The command needs a log directory: tensorboard --logdir runs. It listens on localhost port 6006 by default. --bind_all exposes the dashboard on every interface, while TensorBoard supplies no application login in this local workflow, so put remote access behind your own authenticated proxy or tunnel. Port conflicts and stale processes are common first-run failures.
Writers buffer events. Call flush() during long jobs and close() at shutdown or the newest points may not reach disk. Give each run and each concurrent writer its own directory. TensorBoard recursively discovers those directories, stitches sequential event files for a run, and may hide old points through reservoir sampling. tensorboard --inspect --logdir ... distinguishes an empty file from a wrong path.
TensorFlow itself is not required, but the README lists a reduced plugin set without it and says Google Cloud Storage log directories are unavailable. Version 2.21 raises protobuf to >=6.31.1,<8 and grpcio to >=1.74,<2, which can conflict with an older ML environment. Installing TensorBoard in a separate visualization environment isolates those resolver constraints from training.
Patterns
Open a local dashboard launch-local
tensorboard --logdir runs
# open http://localhost:6006

tensorboard --logdir runs --port 6007
Port 6006 is the default. Choose another port when an existing process already owns it.
Expose through a controlled network path remote-access
tensorboard --logdir runs --bind_all --port 6006`--bind_all` listens beyond localhost and exposes logged training data. Put that listener behind authentication, a firewall, or an SSH tunnel.
Check whether event files contain data inspect-events
tensorboard --inspect --logdir runsInspect mode reports tags and recorded steps without launching the browser, which separates empty events from a UI or path problem.
Write PyTorch training metrics pytorch-scalars
from torch.utils.tensorboard import SummaryWriter

writer = SummaryWriter("runs/exp-01")

for step, batch in enumerate(loader):
    loss = train_step(batch)
    writer.add_scalar("train/loss", loss.item(), step)

writer.close()
SummaryWriter buffers data. `close()` flushes the final events, and the explicit step keeps points in training order.
Log a Keras fit keras-callback
import tensorflow as tf

callback = tf.keras.callbacks.TensorBoard(
    log_dir="runs/keras-01",
    histogram_freq=1,
)

model.fit(
    x_train,
    y_train,
    epochs=10,
    validation_data=(x_valid, y_valid),
    callbacks=[callback],
)
`histogram_freq=1` records weight distributions every epoch and adds training work plus larger event files.
Write TensorFlow 2 summaries manually tensorflow-summary
import tensorflow as tf

writer = tf.summary.create_file_writer("runs/tf-01")

with writer.as_default():
    for step in range(1000):
        loss = train_step()
        tf.summary.scalar("loss", loss, step=step)

writer.flush()
TensorFlow 2 summaries need an explicit step. The TensorFlow 1 `tf.summary.FileWriter` examples use a different API.
Separate experiments by directory compare-runs
runs/
  baseline/events.out.tfevents...
  lr-0.01/events.out.tfevents...
  lr-0.001/events.out.tfevents...

# tensorboard --logdir runs
Each discovered subdirectory becomes a run. Two active writers should not share one directory under the normal reload model.
Record weights and gradients log-histograms
for name, parameter in model.named_parameters():
    writer.add_histogram(
        f"weights/{name}",
        parameter,
        global_step=epoch,
    )
    if parameter.grad is not None:
        writer.add_histogram(
            f"gradients/{name}",
            parameter.grad,
            global_step=epoch,
        )
Histograms store distributions rather than one scalar and can enlarge event files quickly, so epoch-level logging is usually easier to retain.
Write a PyTorch image grid log-images
from torchvision.utils import make_grid

grid = make_grid(images[:16])
writer.add_image("samples", grid, global_step=step)
PyTorch SummaryWriter expects CHW by default. Pass `dataformats='HWC'` when supplying a single height-width-channel array.
Record hyperparameters and final metrics log-hparams
writer.add_hparams(
    {
        "learning_rate": 0.01,
        "batch_size": 64,
        "optimizer": "adam",
    },
    {
        "hparam/accuracy": 0.91,
        "hparam/loss": 0.31,
    },
)
PyTorch `add_hparams()` creates summary data for the HParams view and may create an additional nested run directory.
Send embeddings to Projector embedding-projector
writer.add_embedding(
    features,
    metadata=labels,
    label_img=images,
    global_step=step,
)
The feature tensor has shape N by D. Metadata must contain N labels, and optional image thumbnails must have the same first dimension.
Embed TensorBoard in a notebook notebook-dashboard
%load_ext tensorboard
%tensorboard --logdir runs
The notebook extension launches or reuses a local TensorBoard process. A blank panel can still come from an empty or unflushed event file.
Alternatives
| Package | Registry | Pick it when |
|---|---|---|
| tensorboardX | PyPI | Use it when non-TensorFlow training code only needs to write TensorBoard-compatible event files. |
| wandb | PyPI | Use it for hosted team tracking, artifacts, reports, sweeps, and shared run search. |
| mlflow | PyPI | Use it when a self-hosted tracking server and model registry should own runs and artifacts. |
More ai / ml guides
openai · mcp · huggingface-hub · @modelcontextprotocol/sdk · scikit-learn · tiktoken · the whole shelf →
How this guide is made: grounded in the library's documentation, release notes, changelog, and issue history, on a fixed rubric — not a hands-on install of every release. The 50 most-downloaded entries are additionally install-verified in clean containers. Corrections: contact the desk.