mlflow review
MLflow 3.15.2 is a self-hostable tracking server, Python SDK, web interface, artifact system, and model registry for machine-learning and generative-AI teams. It records experiments, parameters, metrics, models, traces, evaluations, prompts, and deployment metadata, then makes them searchable through APIs and a UI. The current patch adds immutable evaluation-dataset versions and a `scorer_ensemble` primitive, while fixing a Databricks telemetry deadlock and two evaluation or tracking defects. Our v3.15.1 Python 3.12 install imported successfully and shipped typing metadata, but it occupied 608 MB, pulled 90 packages, and contained 1 known vulnerability. Treat it as operational infrastructure with a client library.
MLflow 3.15.1 took 14.3 seconds, installed 90 packages using 608 MB, imported in 3.79 seconds, and produced 1 pip-audit finding in our sandbox. Adopt 3.15.2 when a team will use the shared tracking and registry system enough to justify operating it; do not add the full package for a few local charts.
We installed it
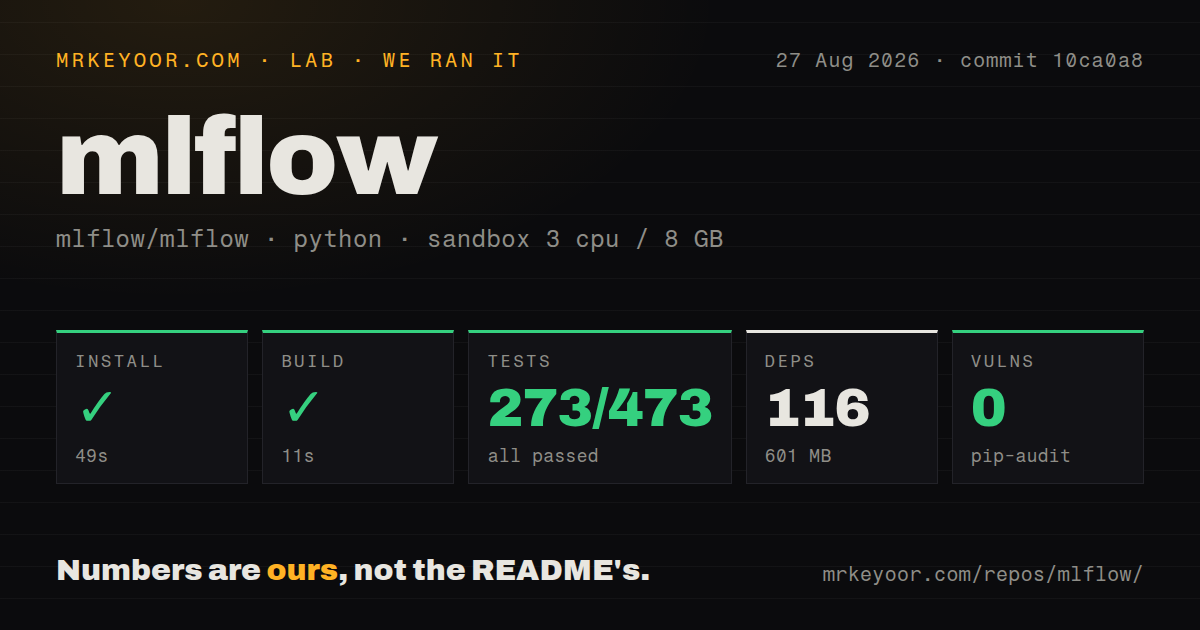
| Install | ✓ · 14.3s | 90 packages on disk · 608 MB |
| Import | ✓ | import mlflow in 3.79s · pure Python · py.typed · requires Python >=3.10 |
| Known vulns | 1 | (pip-audit) |
Answers from our run
Does mlflow install cleanly?
Yes. In a fresh container with an empty cache, pip install mlflow finished in 14 seconds, leaving 90 packages and 608 MB on disk. pip-audit reported 1 known vulnerability.
What does mlflow need to run?
Python >=3.10, and nothing compiled: it is pure Python. In our run import mlflow succeeded in 3.79s, and the package ships py.typed for type checkers.
mlflow or wandb: which should you use?
wandb: Use it when a managed experiment service and collaborative UI matter more than operating the tracking stack yourself. MLflow 3.15.1 took 14.3 seconds, installed 90 packages using 608 MB, imported in 3.79 seconds, and produced 1 pip-audit finding in our sandbox.
When should you not use mlflow?
You only need local loss curves or a few scalar charts. TensorBoard or plain artifacts avoid a service and our measured 608 MB environment.
Use it if
- A team needs a shared history of training parameters, metrics, datasets, artifacts, model versions, and promotion aliases.
- Model-serving code should load a registry alias while operators change the selected version without editing the application.
- One self-hosted system must cover conventional ML experiments plus LLM traces, prompts, scorers, and evaluations.
- Supported framework autologging can replace repeated tracking calls, and the captured data has passed a privacy review.
- You only need local loss curves or a few scalar charts. TensorBoard or plain artifacts avoid a service and our measured 608 MB environment.
- Your release process cannot inspect dependency advisories. pip-audit found 1 known vulnerability in our clean 3.15.1 installation.
- Nobody will own database migrations, artifact credentials, backups, authentication, TLS, retention, and server upgrades.
- LLM tracing is the whole requirement. A narrower tool such as Langfuse avoids model-flavor, registry, and training concepts that your team would not use.
- You need slow-moving GenAI APIs. Recent releases regularly change tracing, evaluation, gateway, scorer, prompt, and permission behavior.
Setup reality
Our lab installed MLflow 3.15.1 in a clean Python 3.12 Bookworm sandbox in 14.3 seconds. The environment contained 90 packages and occupied 608 MB. pip-audit reported 1 known vulnerability. The distribution declares 59 direct dependencies, requires Python 3.10 or newer, is pure Python, and ships py.typed. import mlflow succeeded in 3.79 seconds. These measurements apply to 3.15.1; PyPI now serves 3.15.2.
Without a tracking URI, a script can create local run data where it was launched. Shared use needs a stable tracking URI, a database for tracking and registry records, and an artifact store reachable by either clients or the server's artifact proxy. Back up the database before mlflow db upgrade. Decide which process owns S3, Azure, GCS, or other artifact credentials. Notebook code should not carry production storage secrets just because it logs a model.
A tracking server holds experiment metadata and downloadable model artifacts, so bind and expose it deliberately. Configure authentication, TLS, allowed origins, and resource permissions before team access. SQLite may work for one local user; concurrent services call for a server database and tested connection limits. MLflow 3.13 replaced legacy per-resource permissions with role-based access control, which makes an upgrade from older self-hosted authorization a migration project rather than a package bump.
Autologging can capture model artifacts, dataset details, input examples, prompts, responses, tags, and traces beyond the metric you meant to chart. Review personal data and secret exposure before enabling each integration. Framework flavors add their own environments on top of the 608 MB base we measured. mlflow-skinny can reduce client weight when only tracking APIs are needed, but verify required commands and flavors. Version 3.15.2's immutable evaluation datasets help reproducibility only when callers consistently log and reference those versions.
Patterns
Record parameters and metric steps log-training-run
import mlflow

mlflow.set_tracking_uri('http://127.0.0.1:5000')
mlflow.set_experiment('invoice-risk')

with mlflow.start_run(run_name='depth-8'):
    mlflow.log_param('max_depth', 8)
    for step, loss in enumerate(losses):
        mlflow.log_metric('loss', loss, step=step)
Set the tracking URI before `start_run`. Otherwise the run can land in a local store tied to the process working directory.
Capture a scikit-learn fit enable-sklearn-autolog
import mlflow
from sklearn.ensemble import RandomForestClassifier

mlflow.sklearn.autolog(log_models=True)
with mlflow.start_run():
    model = RandomForestClassifier(n_estimators=200)
    model.fit(X_train, y_train)
Autologging may save the estimator, signature, example, parameters, and metrics. Review the captured input before using sensitive training data.
Load the URI returned by model logging log-and-load-model
with mlflow.start_run():
    info = mlflow.sklearn.log_model(
        sk_model=model,
        name='risk-classifier',
        input_example=X_train[:2],
    )

loaded = mlflow.pyfunc.load_model(info.model_uri)
predictions = loaded.predict(X_test)
Current 3.x examples use `name`. Keep the returned URI instead of reconstructing a run-relative artifact path.
Point an alias at a tested version promote-model-alias
import mlflow
from mlflow import MlflowClient

client = MlflowClient()
client.set_registered_model_alias(
    name='invoice-risk',
    alias='champion',
    version='12',
)
model = mlflow.pyfunc.load_model('models:/invoice-risk@champion')
Alias readers can resolve version 12 immediately after the update. Finish validation before moving `champion`.
Order runs by a metric search-best-runs
runs = mlflow.search_runs(
    experiment_names=['invoice-risk'],
    filter_string='metrics.auc >= 0.90',
    order_by=['metrics.auc DESC'],
    max_results=20,
)
print(runs[['run_id', 'metrics.auc']])
The filter uses MLflow's search syntax. Prefix metrics, parameters, and tags instead of writing database SQL.
Associate a dataset with a run log-dataset-input
import mlflow

dataset = mlflow.data.from_pandas(
    training_frame,
    source='s3://ml-data/invoices/train.parquet',
    name='invoice-training',
)
with mlflow.start_run():
    mlflow.log_input(dataset, context='training')
A source URI and name improve lineage, but access control for the underlying data remains outside MLflow's run record.
Create nested retrieval spans trace-python-functions
import mlflow

@mlflow.trace
def retrieve(question: str) -> list[str]:
    return index.search(question)

@mlflow.trace
def answer(question: str) -> str:
    context = retrieve(question)
    return generate(question, context)
Decorated arguments and return values can enter the trace store. Redact boundaries that carry private prompts or credentials.
Turn on OpenAI autologging trace-openai-client
import mlflow

mlflow.set_tracking_uri('http://127.0.0.1:5000')
mlflow.set_experiment('support-agent')
mlflow.openai.autolog()

# OpenAI client calls made after this line can be traced.
Set the experiment before the first request and review prompt, response, and token data retention before production use.
Separate metadata and artifacts start-tracking-server
mlflow server \
  --backend-store-uri postgresql://mlflow@db/mlflow \
  --artifacts-destination s3://team-mlflow/artifacts \
  --host 127.0.0.1 \
  --port 5000
PostgreSQL stores tracking and registry rows; S3 stores files. Put authenticated TLS access in front of port 5000.
Apply schema migrations before startup upgrade-database-schema
mlflow db upgrade postgresql://mlflow@db/mlflowBack up the database and test the same version jump first. Do not let several new server instances race a schema migration.
Evaluate a prediction function evaluate-model-output
import mlflow

result = mlflow.genai.evaluate(
    data=evaluation_rows,
    predict_fn=answer,
    scorers=[correctness_scorer],
)
print(result.metrics)
Scorers can call external models and create cost or data exposure. Pin scorer definitions and dataset versions with the result.
Use a tracking-only client environment load-skinny-client
from mlflow import MlflowClient

client = MlflowClient(tracking_uri='https://mlflow.example.com')
runs = client.search_runs(
    experiment_ids=['1'],
    max_results=10,
)
`mlflow-skinny` can suit this client pattern, but it omits parts of the full package. Verify every flavor and command before replacing the 608 MB environment we measured.
Alternatives
| Package | Registry | Pick it when |
|---|---|---|
| wandb | PyPI | Use it when a managed experiment service and collaborative UI matter more than operating the tracking stack yourself. |
| neptune | PyPI | Use it when a hosted metadata store fits the team's governance and experiment-comparison workflow. |
| aim | PyPI | Use it for a narrower open-source experiment tracker when model registry, serving, and GenAI gateway features are unnecessary. |
| tensorboard | PyPI | Use it for local scalar, histogram, and graph visualization without running a registry service. |
More ai / ml guides
openai · mcp · huggingface-hub · @modelcontextprotocol/sdk · scikit-learn · tiktoken · the whole shelf →
How this guide is made: grounded in the library's documentation, release notes, changelog, and issue history, on a fixed rubric — not a hands-on install of every release. The 50 most-downloaded entries are additionally install-verified in clean containers. Corrections: contact the desk.