One CLI can query Grafana and change its resources
gcx puts dashboards, alerts, metrics, logs, traces, and profiles behind one command tree. It works with Grafana Cloud, Enterprise, and OSS, and it can emit JSON or YAML for scripts. People can use it directly in a terminal; coding agents get compact output plus packaged skills for investigations and setup work. The result is useful when Grafana already contains the operational truth and opening the web interface breaks the flow.
The project is a Go CLI, although our lab's dependency harness classified the measured checkout as Python. The live README targets Grafana 13 for full self-hosted support, with Grafana 12 receiving only security patches during its remaining support window. Anything below version 12 is rejected with exit code 6. That firm cutoff makes gcx a poor fit for older Grafana estates, even if their HTTP APIs still answer.
Git-backed resource changes come with a sharp delete command
Dashboards and folders can be pulled into local files, validated, previewed, and pushed back. gcx also imports dashboards as Go builder code and can lint resources with Rego rules. That is a practical bridge between an operator inspecting a panel and a repository owning the next revision. The raw API command covers endpoints that do not yet have a dedicated command.
Write access deserves more care than the friendly workflow suggests. A named resources delete action has no confirmation prompt. A type-only selector can delete every matching resource after --force or --yes, while --dry-run is available for preview. Give an agent Viewer access for queries unless its task truly needs Editor or Admin, then keep the target context and namespace explicit.
What happened when we ran it
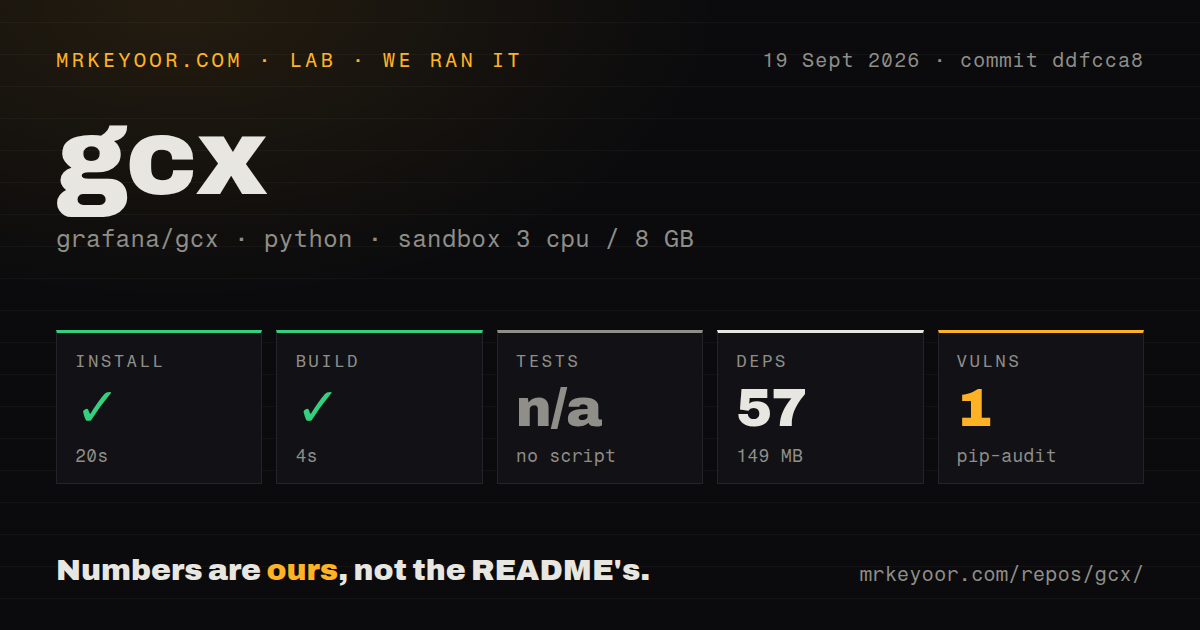
Our sandbox installed commit ddfcca8 in 20 seconds, adding 57 packages and using 149 MB on disk. The build completed successfully in 4 seconds. The unprivileged Debian container had 3 CPUs and 8 GB of RAM, with no secrets. Those results cover repository setup and compilation; they do not measure Grafana API latency or the time required to configure a real stack.
The checkout had 2,545 files, about 336,348 lines of source, and measured 15.7 MB before the installed packages. We found 7 CI workflow files and a Compose file, with no Dockerfile or tests directory. The harness found no test script or target, so it skipped tests. Pip-audit reported 1 known vulnerability. The lab record does not identify the affected package, so we cannot responsibly claim its reach or severity.
Grafana 13 gets the complete self-hosted path
Core resource, alerting, raw API, and signal-query commands work across supported Grafana deployments. Grafana Cloud adds SLO, Synthetic Monitoring, IRM, k6, Fleet, Adaptive Telemetry, and Assistant commands. On a self-hosted stack, datasource endpoints for Prometheus, Loki, Tempo, and Pyroscope must be configured manually rather than discovered from the stack.
Grafana 12 has a specific trap around managed alert rules. Writing them through the resource API needs the kubernetesAlertingRules feature toggle, a server restart, and Unified Alerting. Issue 989 tracks a general way for each command to declare its required server version and feature flags. Until that lands, check the compatibility table before turning a working read workflow into an automated write workflow.
Authentication can involve two credentials and an OS keychain
Interactive Grafana Cloud login opens a browser and stores OAuth material in the operating system's credential store. Version 1.3.0 fails closed if that keychain is unavailable, unless the user explicitly sets GCX_KEYCHAIN=off and accepts plaintext storage. A sandboxed coding agent may need approval to run the login outside its sandbox, which is a sensible restriction around production tokens.
Automation usually uses a Grafana service account token. Cloud product commands can also need a Cloud Access Policy token, since instance authentication and the Cloud platform are separate. The README maps Viewer to query and read work, Editor to resource changes, and Admin to datasource configuration. gcx also sends limited usage statistics to Grafana Labs and links to instructions for disabling them.
September 2026 activity is fast, with breaking changes still arriving
GitHub showed 707 stars and 263 open issues and pull requests when fetched. Search returned 169 open issues, and the repository's last push was September 19, 2026. The newest release we found, v1.3.0 from September 14, changed keychain failure behavior, Fleet permissions, Synthetic Monitoring probe manifests, and several output shapes. This is active software, but automation needs version pins and release-note review.
The open queue also reflects work still in motion. Issue 1360 asks for nested folder paths in dashboard listings, while issue 1359 requests persistent include and exclude filters for resources. Neither prevents the documented core flow. They do show why gcx works best as a controlled operator tool, with output checked before it becomes an agent's unattended input.
Choose gcx when Grafana is already the center of operations
The strongest alternative depends on the job. grafana/mcp-grafana is a direct MCP server for AI clients and supports older Grafana versions than gcx. grafana/terraform-provider-grafana gives infrastructure teams durable desired state and plan review. gcx earns its place between them: it handles live queries, investigations, agent skills, and Git-backed resource work from the same binary.
Our 20-second install and 4-second build make a trial cheap, but the skipped test step and 1 audit finding leave verification work for your own environment. Start with a Viewer token against a non-production context. Promote only the commands you have checked, use dry runs for resource changes, and treat version upgrades as changes to an operational interface rather than routine package refreshes.