Prometheus pulls labeled metrics into an autonomous server
Prometheus scrapes HTTP endpoints, stores samples as time series identified by metric names and labels, and lets operators query them with PromQL. Rules turn queries into recorded series or alerts. Service discovery can find changing targets, while static configuration covers small deployments. The server also has a web interface and HTTP API.
Its architecture has a strong opinion: each server is autonomous and does not depend on distributed storage. That keeps a single installation understandable and lets a team monitor one environment without first building a database cluster. Federation and remote read or write can connect larger systems. They remain architecture choices outside the simple server, which is why Prometheus can feel easy in a lab and become a design project across regions or long retention periods.
The pull model favors services with stable scrape targets
Prometheus expects applications or exporters to expose current metrics for periodic collection. This works well for long-running services because the server controls cadence, notices missing targets, and attaches discovery labels before storage. Batch jobs have a different lifetime, so the README points them to an intermediary push gateway. A system in which every producer must send events directly into storage may fit another database more naturally.
Label design matters as much as installation. A metric name plus key and value dimensions makes queries flexible, but unbounded labels can create an expensive number of series. Retention, scrape intervals, rule evaluation, and failure domains also need explicit decisions. Prometheus supplies the measurement engine and query language. Alert routing usually belongs to Alertmanager, visual analysis often belongs to Grafana, and durable global storage can belong to a remote backend.
What happened when we ran it
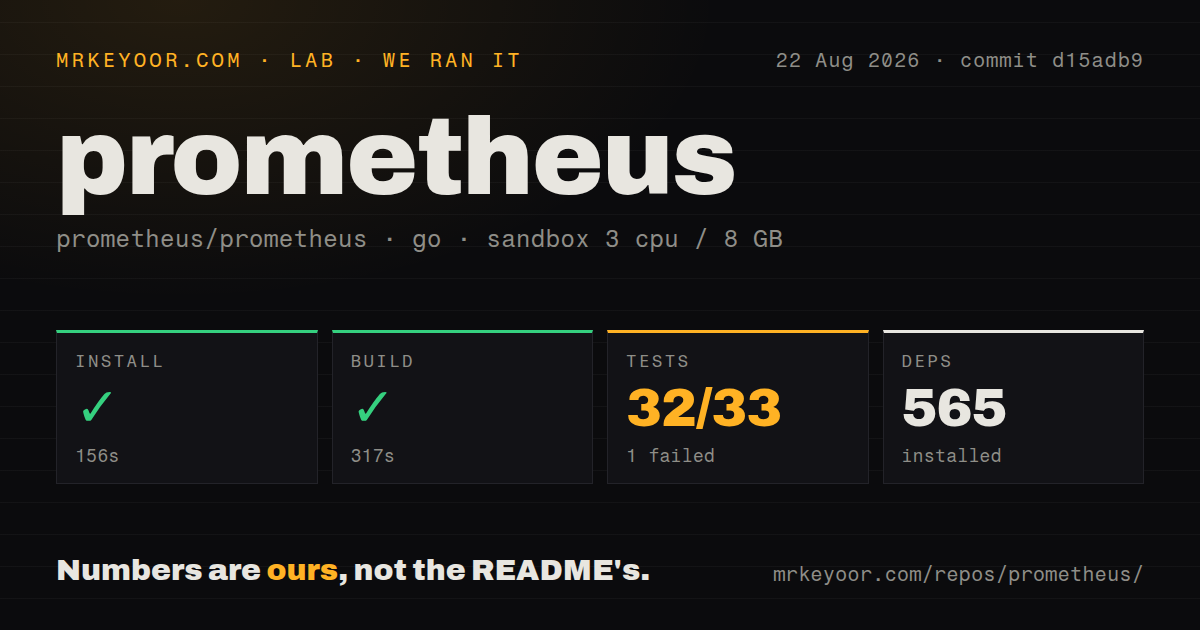
Our sandbox installed 565 Go packages in 156 seconds from commit d15adb9. The build completed successfully in 317 seconds. The checkout itself was 28.9 MB with 1,662 files and roughly 418,879 lines of source. We found 15 CI workflow files, a Dockerfile, and no top-level tests directory. Go packages commonly keep tests beside source, so that last signal is about layout rather than coverage.
The test step ran for 582 seconds and exited with code 1. The supplied Go summary counted 32 passed results and one failure out of 33. Its final lines show successful packages including util/strutil, util/teststorage, web, and web/api/v1, mixed with packages that had no test files. The excerpt then ends at FAIL without naming the failed package or showing its assertion.
We can say that installation and compilation succeeded while the complete test command did not. We cannot attribute the single failure to Debian, missing services, timing, or a code defect because the supplied log tail does not establish any of those causes. A contributor needs the full test output from this commit before deciding whether a change is safe. For an operator, the project recommends precompiled production releases instead of a source checkout.
A complete source build includes the React interface
The source path needs the Go version declared in go.mod, the Node.js version in the UI's .nvmrc, and npm 10 or newer. A direct go install builds prometheus and promtool, but the server then expects web assets under the cloned repository and omits the React UI unless assets are built separately. make build compiles those assets into binaries that can run elsewhere.
That distinction explains part of the 317-second build we measured. It also prevents a common deployment mistake: a Go binary can start while serving an incomplete interface because its expected files stayed in the source tree. The official Docker images and release archives reduce this packaging work. Teams producing custom builds, perhaps to trim service-discovery plugins with build tags, inherit responsibility for the UI assets and resulting artifact.
The standalone program is a poor promise for Go API stability
The README directly warns that this repository is not designed as a reusable Go library. Internal pieces may surface errors in embedded use, and user-facing v3 releases map to v0 module tags such as the documented v3.0.0 to v0.300.0 example. Major version zero permits breaking Go API changes between minor tags. Prometheus publishes reusable work in repositories such as prometheus/common and prometheus/client_golang; those are safer dependencies for application instrumentation.
Remote Write protobufs are published separately, although the README labels that library path experimental. Open issue 17857 also says the current Remote Write 2.0 sender can emit exemplars separately from samples, contrary to the specification described in the report. Teams adopting newer protocol features should test the exact sender and receiver pair. Stable everyday scraping does not make every experimental storage edge equally mature.
v3.14.0 fixed data risks while new storage work continues
Release v3.14.0 was published on August 18, 2026. Its notes include fixes for potential data loss during out-of-order compaction, incorrect native histograms after restart, missing samples after deleted-series restart, and query errors that had been discarded. It also added OCI service discovery and made PromQL duration expressions default. These are substantial reasons to read upgrade notes rather than treating a minor release as routine.
GitHub recorded a push on August 26, 2026. The repository had 65,844 stars and 889 combined issues and pull requests when fetched, with issue activity continuing on August 27. One current report describes an extra response-body copy when scraping very large targets and links a proposed fix. This is a mature project under active development, with a surface broad enough that operators still need release testing around their own storage and discovery features.
Prometheus earns its place when teams want scrape-based monitoring and PromQL. The prebuilt path is much easier than our 565-package source setup. Use the standalone server for collection and local querying, then add Alertmanager and remote storage where required. If distributed, multi-tenant retention is the starting requirement, evaluate a clustered metrics backend first.