Sentry connects an error to the work needed to fix it
An exception tracker earns its place when it removes detective work. Sentry's application brings an issue together with traces, session replays, logs, performance information, and uptime data. Its README frames the job plainly: detect, trace, and fix software problems. That makes it a fit for teams whose production failures cross browser code, APIs, queues, and services, where a stack trace alone leaves too many questions unanswered.
The surrounding SDK list is a major part of that value. Sentry links official clients for JavaScript, Python, Ruby, PHP, Go, Rust, Java, .NET, mobile platforms, game engines, and more. A mixed stack can send failures into one issue workflow instead of maintaining a different tool per runtime. The trade is organizational: alerts, ownership, retention, and event volume still need decisions, even when instrumentation is available.
The 21,422-file repository is contributor infrastructure
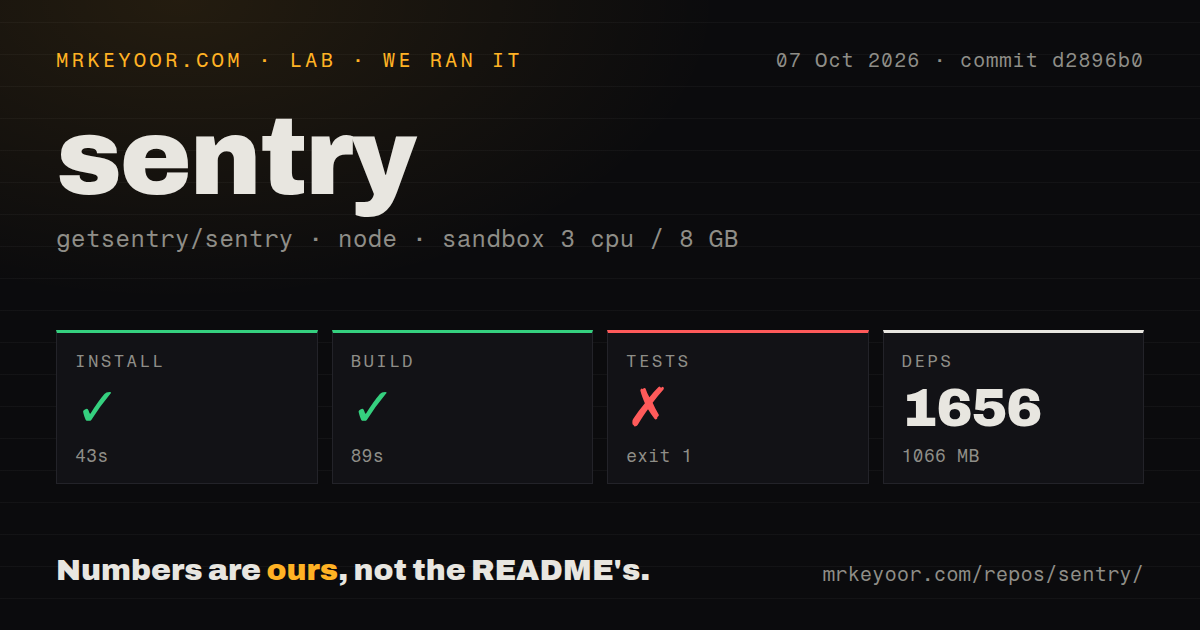
Our measured checkout at commit d2896b0 contained 21,422 files, about 3,339,336 lines of source, and occupied 234.5 MB. It combines a Python application with a large React and TypeScript interface, pnpm workspaces, build utilities, API documentation, fixtures, migrations, and 32 CI workflow files. Calling it a Node project describes the harness path we ran, not the whole system.
That distinction matters before you clone it. The root README explains the product and points outward to developer documentation, discussions, Discord, and the bug tracker. Repository instructions say backend work begins with devenv sync, direnv allow, and devservices up. Frontend development can run against the full local stack or use a UI-only server that proxies an API. Neither route is the same job as installing an SDK in your application.
What happened when we ran it
Our sandbox installed commit d2896b0 in 43 seconds. Pnpm added 1,656 packages and the installed tree occupied 1,066 MB. The production-oriented front-end build then succeeded in 89 seconds inside an unprivileged Debian container with 3 CPUs, 8 GB of RAM, Node 22, and no secrets. Those results prove that the JavaScript dependency and build paths completed under the measured limits.
The test command failed after 11 seconds. Jest reported 0 of 2,361 suites and 0 tests executed. The log tail is a Node module-loading stack that ends in @swc/core/index.js, followed by pnpm's lifecycle failure. It does not include the first exception line, so the evidence does not tell us whether the cause was a missing native binary, an unsupported platform detail, or something else.
A failure before test discovery is more serious for a new contributor than a handful of red assertions. There is no passing subset to separate working areas from broken ones in this run. The repository does contain a tests directory and 32 CI workflow files, which shows substantial test machinery exists. Still, commit d2896b0 did not give our fresh Node 22 container a usable JavaScript test baseline.
The full development stack starts beyond pnpm
The package build covers the interface, while Sentry's backend declares Python 3.13 or newer and a long service-facing dependency list. Its checked-in Python configuration names Sentry's internal package index as the default. The contributor guide also requires devservices before pytest or the full development server. A developer outside Sentry should read those environment instructions before treating the successful 89-second build as proof that the complete application is ready.
The project keeps a self-hosted directory with an application Dockerfile and configuration, but Sentry's supported installation lives in the separate getsentry/self-hosted repository. That project assembles the wider service set. If your goal is to operate Sentry, start there. If your goal is to change Sentry itself, this repository is the right source, and the local service environment becomes part of the work.
The license permits internal use but blocks a current clone service
Current code uses FSL-1.1-Apache-2.0. The license permits internal use, education, research, modification, and redistribution under its terms, but it excludes using the software in a commercial product or service that competes with Sentry. Each released version receives an Apache 2.0 license after two years. That delay is concrete enough to involve counsel if your product overlaps with hosted error monitoring.
For ordinary internal deployment, the more immediate cost is operational. Sentry's product surface spans errors, performance, tracing, replay, logs, and uptime. That range can replace several disconnected debugging views, but it also produces more data and more configuration than a basic exception collector. A team should choose it because those connections improve its incident work, not because the SDK integration itself is quick.
An October 8 push and 2,256 open items show active work
GitHub recorded a push on October 8, 2026, and listed 2,256 open issues and pull requests combined. The latest release, 26.9.0, was published on September 15, 2026. Recent issue activity included discussion of webhook delivery identifiers and clarification of Microsoft Teams installation guidance. Together, the fresh push, recent release, and current conversations show active maintenance, while the queue size reflects a very large product.
Sentry is the sensible choice when engineers need one issue to carry enough context to act, and the team will either buy the hosted service or own a serious self-hosted stack. The main repository is less inviting as a casual contribution target: our build worked, but all 2,361 suites remained unstarted. Begin with the supported deployment project for operations, and budget time for Sentry's development environment before promising a source change.