
One collector for four kinds of telemetry
Grafana Alloy collects metrics, logs, traces, and profiles, then sends them through a graph of configurable components. It is Grafana's OpenTelemetry Collector distribution, with native Prometheus pipelines and direct ties to Loki and Pyroscope. The project can still send data to other vendors or open-source databases. That makes it useful for teams that want fewer agents without making Grafana Cloud a requirement.
The configuration model is the main difference. Alloy uses an expression-based language in which each labeled component exposes outputs that feed another component's inputs. A receiver can pass telemetry to a batch processor, which can pass it to an OTLP exporter. The graph is explicit and readable once you know the syntax. It is also another language for operators to learn, especially if they already maintain upstream OpenTelemetry Collector YAML.
Alloy goes beyond basic forwarding. The README documents modules for sharing pipeline definitions, clustering that distributes supported workloads across instances, remote configuration, Kubernetes resource integration, and a built-in web interface for inspecting pipelines. Those features address real fleet problems. A large platform team can keep common logic in modules, distribute discovery work, and inspect the running graph without assembling those parts around a smaller collector.
What happened when we ran it
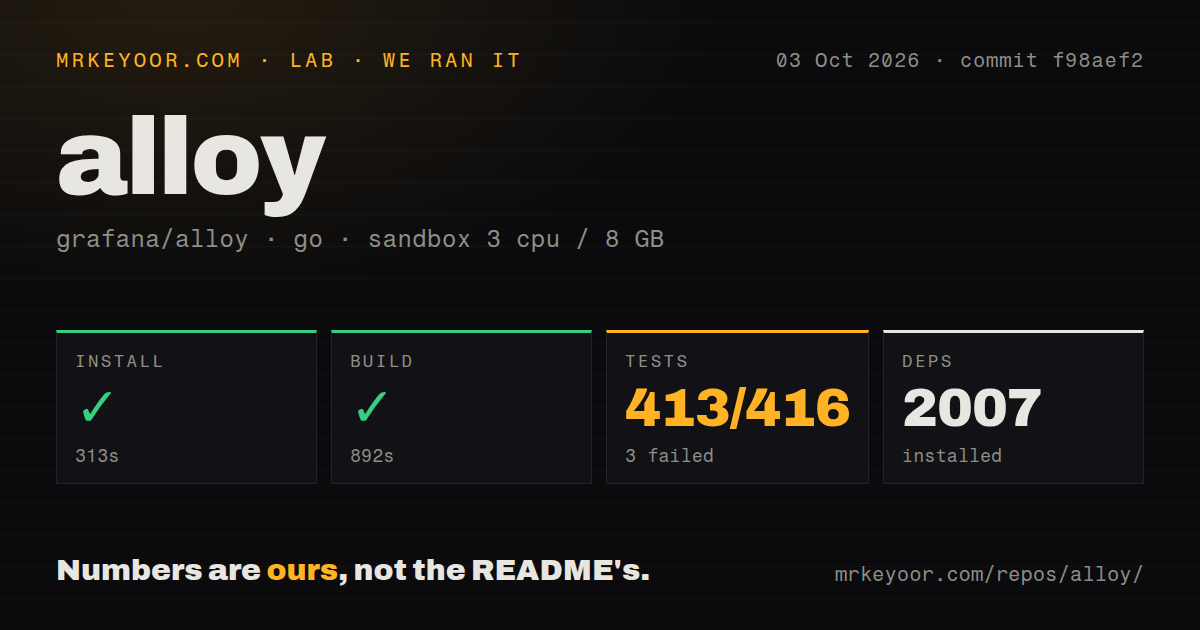
We cloned commit 4c38724 on 2026-08-25 into an unprivileged container with 3 CPUs, 8 GB of RAM, no secrets, and the golang:1.24-bookworm image. The checkout contained 4,198 files, about 395,894 lines of source, and occupied 39.3 MB. The repository had 57 CI workflow files, a Dockerfile, and no separate tests directory.
Install succeeded in 334 seconds and installed 0 packages. Build then succeeded in 552 seconds. This was a sizeable source build even on three CPUs, so most users should prefer Grafana's packages or container images unless they need to modify Alloy itself.
The test command ran for 631 seconds and exited with failure. It reported 400 passing tests and 3 failures out of 403. The supplied end of the log listed successful packages such as the validator, VCS utilities, and the web UI, followed by a bare FAIL. It did not include the names, error messages, or stack traces for the failed tests. We can say the checkout did not pass the full suite in this sandbox; the available log does not support a diagnosis.
Configuration is where the work lives
Getting an Alloy process to start is the easy part. Its install guide covers Linux packages, Docker, macOS, Windows, and Kubernetes, while the README points new users to a getting-started path and a long component reference. The first useful configuration still requires deliberate choices: which signals enter, how they are filtered or batched, where they leave, and how each protected endpoint authenticates.
That flexibility pays off when a team already operates several collectors. Prometheus scraping can live beside OTLP receivers, Loki processing, and profile delivery in one graph. The debugging UI gives operators a place to see component health and connections. Remote configuration can centralize changes, while clustering can spread compatible work across Alloy instances. Each benefit grows with fleet size. For a single host sending one log stream, the same component model is extra machinery.
Permissions also vary by component. Kubernetes discovery needs access to cluster resources. Host and container integrations need the relevant sockets, files, or system interfaces. eBPF-based work has a different security profile from receiving OTLP over a network port. A small proof should therefore use the same deployment shape, permissions, and destinations as production. A demo that only accepts local OTLP traffic says little about a DaemonSet reading host data.
Breadth creates a wide failure surface
Alloy's release notes deserve a place in every upgrade checklist. Version 1.19.0 removed prometheus.write.queue, renamed memory-limiter telemetry inherited from OpenTelemetry Collector, and changed default file-access behavior for ServiceMonitor endpoints. These are documented breaking changes in a normal minor release. Teams that pin dashboards or depend on older component behavior need to read the notes and validate configurations before rollout.
Current issues show why component-level testing matters. One open report says the official v1.19.0 Windows Server 2022 container terminates before producing logs, while the same deployment works when pinned to v1.18.1. Another report describes loki.source.docker repeatedly sending the last batch from a silent container. These reports do not make every Alloy pipeline unreliable. They do mean that success with one receiver, operating system, or signal should not be treated as proof for another.
The component catalog also mixes several ecosystems with their own upstream changes. Release 1.19.0 updated OpenTelemetry Collector and Prometheus code while adding new components and fixes. That pace brings capabilities quickly, but it gives operators more change to absorb than a narrow log shipper would. Pin images by version, keep a staging pipeline, and watch both Alloy health and the destination for dropped or duplicated data.
Healthy project, demanding adoption
The repository was pushed on 2026-08-25, one day after v1.19.0 was published. GitHub listed 1,201 open issues and pull requests combined, and issue updates were arriving the same day. The raw count is large because Alloy has many components and an active contribution queue. The recent push, frequent release cadence, and current triage activity point to an actively maintained project rather than a quiet backlog.
Alloy is a strong choice for an observability platform team prepared to own configuration and upgrades. It is less attractive as an automatic replacement for every existing agent. Choose a specific first job, compare its configuration with upstream OpenTelemetry Collector or a focused shipper, and run the relevant failure tests. The product earns its operational cost when one maintained graph can replace several independently managed telemetry paths.