Version 1.1.0 turns aggregate history into daily data
GitHub Stars History wraps GitHub's privacy-safe star-history endpoint in a small Python command. Version 1.1.0 reads weekly buckets, expands their seven daily values, sorts the result, and calculates 7-day, 30-day, 365-day, and lifetime totals. You can inspect one repository, pass several names for comparison, print a summary, or export the series as CSV or JSON. That is a focused job, and the code does not pretend to be a full analytics platform.
The privacy boundary is useful as well as limiting. The endpoint returns daily counts without usernames, and the tool stores nothing itself. A maintainer can measure growth without assembling a list of people who starred a project. Version 1.1.0 replaced the older per-stargazer route after GitHub restricted that data in June 2026. If you need identities, this project cannot recover them. For launch analysis and trend lines, counts are usually the cleaner input anyway.
A daily spike records timing, not motive
A CSV row with 200 stars on one day is a lead, not a verdict about what caused those stars. The README suggests using vertical jumps to investigate suspicious activity, but the exported series contains no referral source, account age, campaign record, or outside event. A release, conference talk, popular post, or paid campaign can produce a similar shape. GitHub Stars History tells you when to look. You still have to correlate that date with evidence elsewhere.
This distinction matters because the repository links to commercial GitHub-star services and describes star velocity as a discovery signal. The tool's own calculations do not test search position, Trending placement, or star quality. Its peak-day result is arithmetic over GitHub's aggregate counts. Treating that result as proof of ranking impact or purchased activity would ask the data to answer a question it does not contain. Used as a timeline generator, the project stays on firm ground.
What happened when we ran it
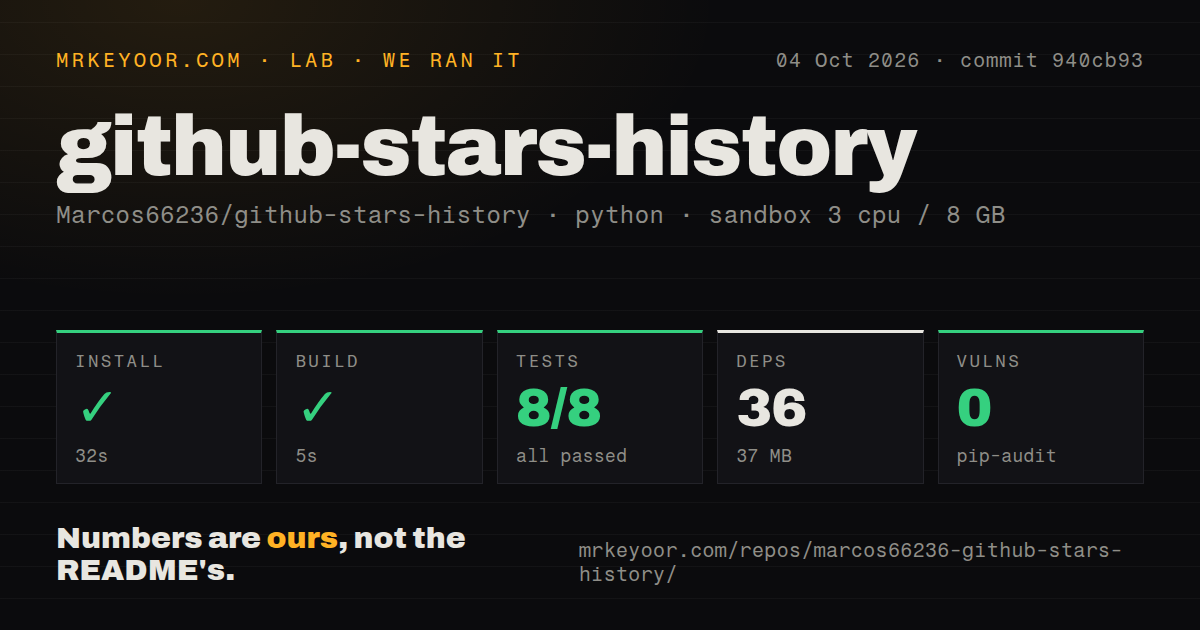
Our sandbox installed commit 940cb93 in 32 seconds. The fresh Debian container had 3 CPUs, 8 GB of RAM, Python 3.12, no secrets, and no elevated privileges. Installation added 36 packages and occupied 37 MB. The build finished successfully in 5 seconds. Those figures support the README's claim that local setup is light, although they do not measure GitHub API response time on a large repository.
Pytest completed in 5 seconds with 8 passed and 0 failed out of 8. Pip-audit reported 0 known vulnerabilities. The repository itself contained 14 files and roughly 503 lines of source at the tested commit, plus a tests directory. Our scan found no Dockerfile and 0 CI workflow files. The green local suite is good evidence for the paths it covers, but the repository does not show an automated check running those tests on every change.
The 60-request anonymous limit is the main runtime constraint
Public repositories need no credential, and the README documents 60 GitHub API requests per hour for anonymous callers versus 5,000 with a token. The client follows pagination links and reads rate-limit headers from each response. When the remaining quota reaches 5, it waits until GitHub's reset time instead of sending probe requests. That behavior is considerate, though a long wait can surprise an unattended reporting job.
A token also changes the security job. Public analysis needs no special scope, while private repositories require a token that can see them. The process reads GITHUB_TOKEN from its environment, so a scheduled task needs secret injection and log discipline. CSV and JSON files are written to the current directory by default. For a team report, choose the output path, retain the raw series, and record the retrieval date so later comparisons use the same artifact.
The main command exports data rather than a browser graph
The project name promises history and visualization, but the primary command produces a printed summary and either CSV or JSON. An included 30-day velocity example renders bars in the terminal. That may be exactly right for analysts who will load the rows into a notebook or dashboard. It is a mismatch for someone expecting an interactive page, shareable image, or README badge from one command.
Star History supplies the visual product: its browser interface compares repositories and creates embeddable charts. The Rust project dtolnay/star-history opens a D3 graph locally, while k1LoW/gh-star-history fits users who want monthly or yearly counts inside GitHub CLI. This Python project wins when daily machine-readable output is the point. It loses when presentation is the point, because you must build that layer yourself.
A September 18 push shows activity, not a long track record
GitHub Stars History was created on September 16, 2026, released version 1.1.0 on September 18, and was last pushed that same day. GitHub showed 276 stars, 29 forks, and 0 open issues or pull requests on October 4. Those numbers describe quick early attention and a quiet queue. With no issue history to inspect, they say little about response quality when users report edge cases.
The short history is the reason to keep adoption proportional to the job. A 503-line utility with 8 passing tests is easy to read, pin, and replace, so using it for an internal report carries limited switching cost. Making it the sole source for public claims needs more care. Preserve its exported data, verify surprising peaks against another source, and remember what the result can prove: the date and size of a change, not the story behind it.