Langfuse connects an LLM trace to the decisions around it
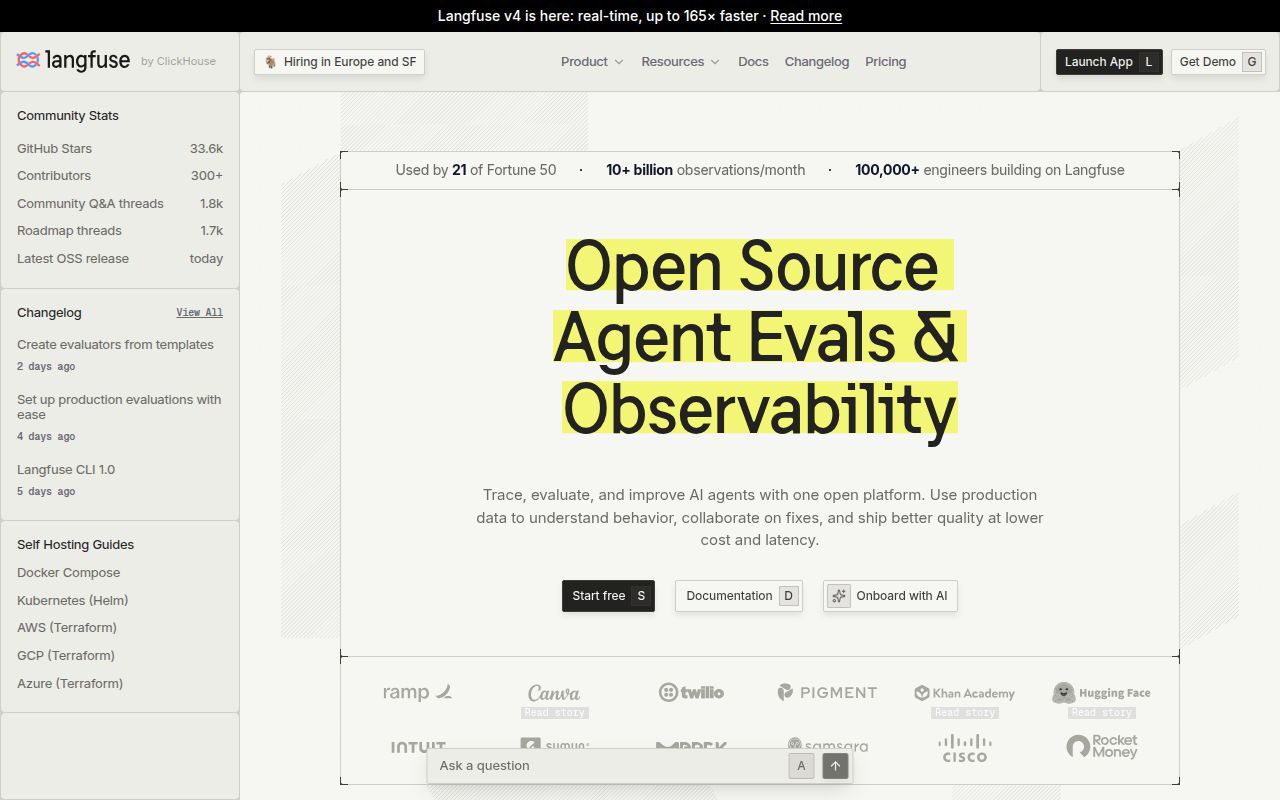
Langfuse records model calls, retrieval steps, embeddings, agent actions, and other application events as traces. The useful part comes after collection. Teams can attach prompt versions, user feedback, evaluator scores, costs, sessions, and dataset runs to the same work. A bad output can move from a production trace into the playground or an evaluation set instead of becoming a screenshot in a chat channel. That workflow distinguishes Langfuse from a dashboard that only totals tokens and latency.
The README is English first and links Chinese, Japanese, and Korean translations. Its integration table covers Python and TypeScript SDKs, OpenAI wrappers, LangChain, LlamaIndex, LiteLLM, Vercel AI SDK, and direct API use. Release v4.19.0 and a repository push both landed on August 25, 2026. GitHub listed 852 issues and pull requests combined, with same-day changes to evaluator jobs, audit-log access, trace cost display, datasets, and the in-app agent.
Observability pays off only when teams use the feedback loop
Tracing model calls can answer concrete questions: which prompt version produced a regression, where an agent loop spent its tokens, which retrieval step supplied a bad context, and whether a new model improved a saved dataset. Prompt management adds central versions and client caching. Evaluation options include model judges, code evaluators, user feedback, and manual labels. Those pieces allow a team to turn a production failure into a repeatable case.
A small application with 20 internal users may not need that machinery. Instrumentation copies prompts, outputs, metadata, and sometimes user identifiers into an additional system. The team must set retention, redact sensitive fields, control project access, and decide which evaluations merit their own model spend. If nobody owns those decisions, the platform becomes an expensive request archive. Langfuse is most convincing when product and engineering already review traces and are ready to make datasets part of release work.
Cloud is the easy trial; self-hosting is a data-platform job
The hosted path starts with a project and 2 credentials: a public key and a secret key. Applications also set the regional base URL, then use an SDK decorator, wrapper, integration, or API to send traces. That is the fastest way to judge the interface and query model. It still requires a policy for captured content and access, because an observability system sees much of what users send to an AI feature.
Self-hosting begins with 'docker compose up', and the README links single-VM instructions plus Terraform templates for 3 major clouds. Kubernetes with Helm is described as the preferred production deployment. Langfuse uses ClickHouse, and the repository contains separate web and worker Dockerfiles even though our root scanner found none. Production ownership therefore includes application services, analytics storage, credentials, migrations, backups, retention, and version upgrades, not just one web container.
What happened when we ran it
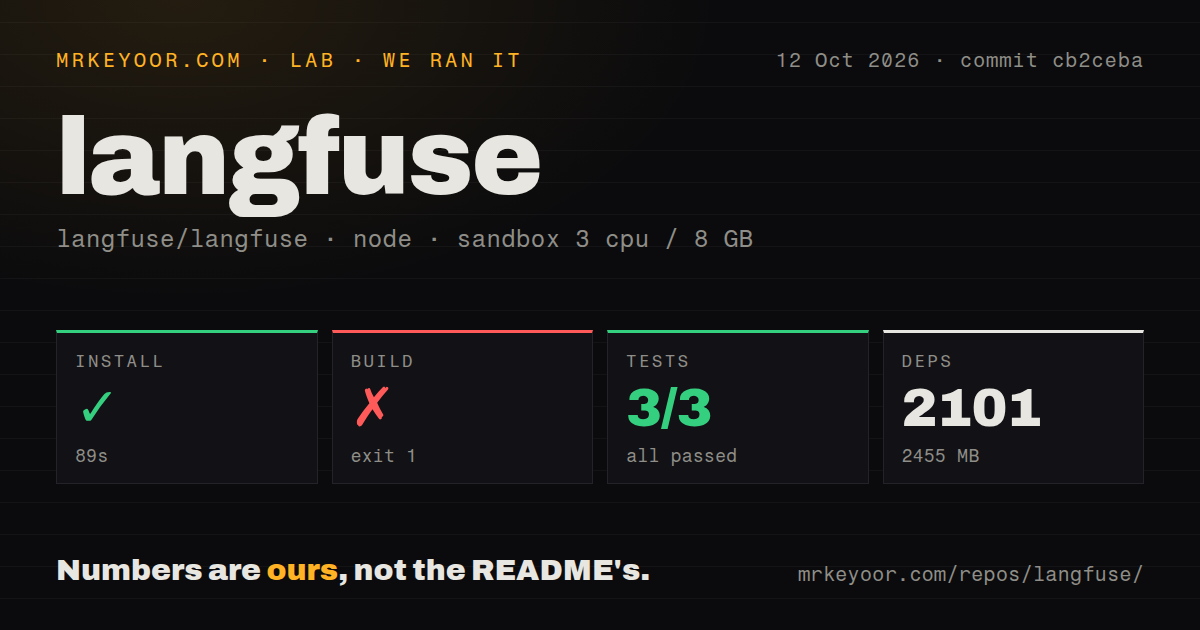
Our sandbox cloned commit 'c293124' into a 41.7 MB checkout with 5,324 files and roughly 943,210 source lines. On Node 22, pnpm installed 1,934 packages in 74 seconds and occupied 2,182 MB. The install succeeded without secrets. The repository was a monorepo with 28 CI workflow files and a compose file, but it did not expose a conventional root tests directory or root Dockerfile to the harness.
The build failed after 12 seconds. Five of 7 tasks succeeded, then the web build reported 'Invalid environment variables' at 'src/env.mjs:40' and exited 1. That message establishes a configuration gate; it does not tell us which values were absent or whether one documented deployment file would have satisfied them. The useful finding is narrower: installing dependencies did not make the full source build ready in our secret-free Debian container.
The aggregate test command failed after 28 seconds. Our harness summarized 3 passed and 0 failed tests in the parsed Vitest result, while the log showed more package-level work: the sandbox runtime passed 3 tests, the ESLint plugin passed 816, and '@langfuse/shared' reported 37 failed files, 56 passed files, 712 passed tests, and 2 skipped. The command still exited 1. Those mixed summaries make the exit status the decision-grade result.
The license boundary deserves an early check
The README calls the repository MIT licensed except for directories named 'ee'. That exception is easy to miss if a buyer stops at the badge. Before designing around a feature, verify whether its implementation sits in the MIT portion, the enterprise portion, or a hosted offering. This matters most for teams choosing self-hosting specifically to retain modification or redistribution rights. The correct comparison is feature by feature, not one blanket label.
The project is now part of ClickHouse according to the README, and ClickHouse is also the analytics database named in the architecture. Current activity is high: v4.19.0 was released the same day we inspected it, and issue work covered both access checks and data presentation. That is reassuring for maintenance, though frequent v4 changes make release notes and staging upgrades more important for self-hosters who cannot accept dashboard or ingestion regressions.
Choose Langfuse when traces must become tests
Phoenix is the closest alternative for teams focused on trace analysis and experiments. Helicone makes sense when a gateway is the natural observation point. OpenLIT fits organizations already standardizing AI telemetry around OpenTelemetry and infrastructure metrics. Langfuse has the clearest case when prompt management, trace inspection, datasets, and evaluation all belong in one shared product workflow.
Our failed 12-second build lowers confidence in a casual source checkout, while the documented Compose and managed paths remain credible ways to evaluate the product. Start with representative traces, test redaction and access, then create one dataset from actual failures. If that loop changes releases, Langfuse is doing useful work. If the team only checks a usage graph once a month, a narrower proxy or existing telemetry backend is likely enough.