At least 10 runs make a better default than a shell loop
Hyperfine turns an arbitrary shell command into a repeated benchmark and reports its timing distribution. By default it performs at least 10 measured runs and estimates a count that targets roughly 3 seconds. You can set an exact run count when a comparison needs a fixed protocol. Multiple commands receive a relative comparison, while CSV, JSON, Markdown, and AsciiDoc exports keep the result available after the terminal scrolls away.
That makes Hyperfine a good replacement for loops around time. It also handles warmup runs, a preparation command before each measurement, and parameter sweeps for values such as thread count. These controls save work, but they do not decide the experiment. A warm cache answers a different question from a cold one. Changing the input file, machine load, power mode, or compiler flags can matter more than a neat relative-speed line.
The 238-test result supports a small, mature codebase
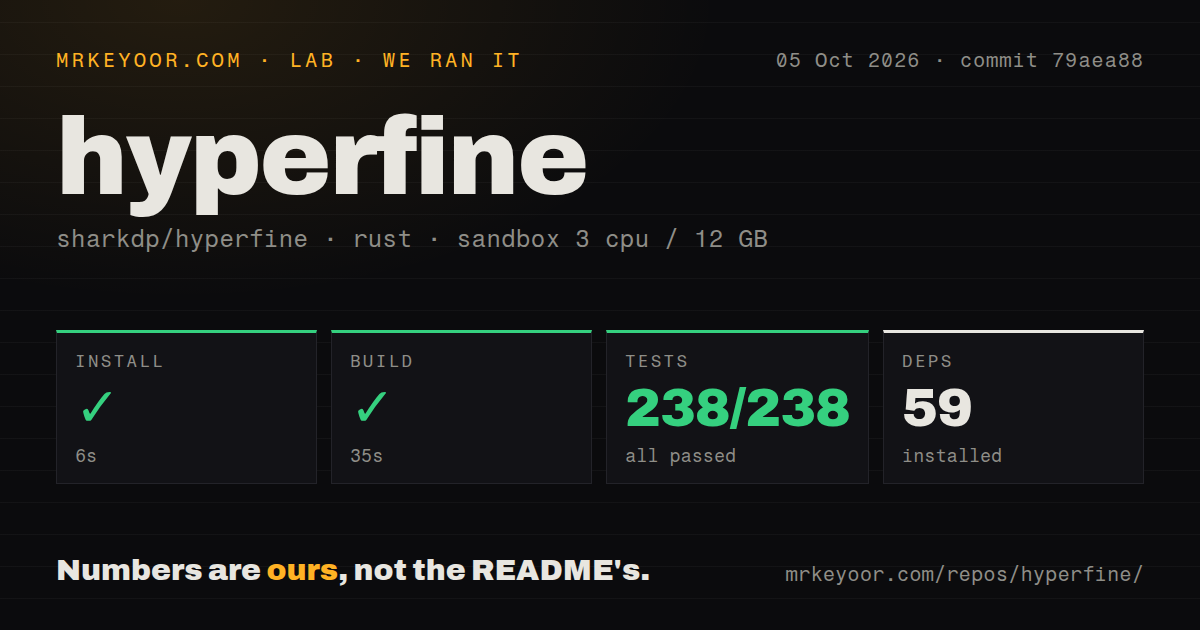
Our sandbox installed commit 79aea88 in 6 seconds and added 59 packages. The Rust build succeeded in 35 seconds. Cargo test took another 35 seconds and reported 238 passed with 0 failed of 238. We used an unprivileged container with 3 CPUs, 12 GB of RAM, and no secrets. These are repository checks, not a benchmark of Hyperfine's timing overhead.
The checkout occupied 0.5 MB and contained 66 files with roughly 8,101 lines of source. It had a tests directory and 1 CI workflow. There was no Dockerfile, which suits the job: benchmarking inside a container would answer questions about that container's scheduler, filesystem, and limits. Hyperfine is generally more useful installed on the same host and environment where the target command actually runs.
What happened when we ran it
Our run completed every supplied stage at commit 79aea88. Installation took 6 seconds for 59 packages, the build took 35 seconds, and all 238 Cargo tests passed in 35 seconds. No failure appeared in the provided results. We did not compare commands or claim a minimum timing error, because the lab block measured project setup and tests rather than benchmark accuracy.
The successful suite matters because Hyperfine performs calibration, statistics, formatting, shell handling, and cross-platform process measurement. Version 1.21.0 also changed timing-related code, including per-command peak-memory collection on Unix and Windows CPU-time precision. A green 238-test run cannot prove every operating system path, but it is relevant evidence for the exact commit we reviewed.
Commands under 5 ms need the no-shell option
On Unix, Hyperfine normally starts commands through sh; Windows uses cmd.exe. It measures empty-shell startup and subtracts that calibration from results. For very fast commands under 5 ms, the README recommends --shell=none, also available as -N, because shell correction can become a meaningful part of the number. Direct execution then loses shell syntax such as globs and home-directory expansion.
This is the sort of limitation good benchmark tooling should expose. The default is convenient for pipelines and redirection. Direct execution gives a cleaner path for tiny programs. Neither mode removes process startup, operating-system scheduling, CPU frequency changes, or background tasks. If you need to measure a Rust function rather than a whole executable, Criterion.rs puts the benchmark closer to the code and avoids pretending a process-level tool sees inside it.
Warmups and preparation commands answer different questions
A warmup count runs the command before recorded measurements, which is useful when caches and just-in-time work should already be settled. A preparation command runs before each timed execution and can restore files or clear state. Hyperfine also separates one-time setup for each parameterized command. Mixing these phases into the measured command can turn cleanup work into apparent program time.
The parameter tools are especially practical. A numeric scan can vary a value from 1 through 12, while a list can compare named compilers or Git branches. $HYPERFINE_ITERATION supplies a unique zero-based value to each run when outputs must not collide. These features make a benchmark repeatable enough to share, provided the command, input, warmup policy, machine details, and Hyperfine version travel with the result.
JSON exports do not provide a benchmark history
Hyperfine can write every measured duration plus wall-clock, user, and system time to JSON. On Unix and macOS, it can include peak resident memory. That memory field is the largest per-process peak among the command and waited-for children, rather than their simultaneous total; Windows memory is unsupported. Those definitions matter when a child-heavy program is being compared with a single process.
The tool does not manage a long-lived baseline by itself. Open issue 607 asks for saving a run and loading it into a later comparison. Hyperfine's README points to Bencher for continuous benchmarking and Chronologer for plotting measurements through Git history. Exporting JSON into one of those systems is the right move when a team needs regression thresholds and results that survive across machines or releases.
Version 1.21.0 arrived with active maintenance
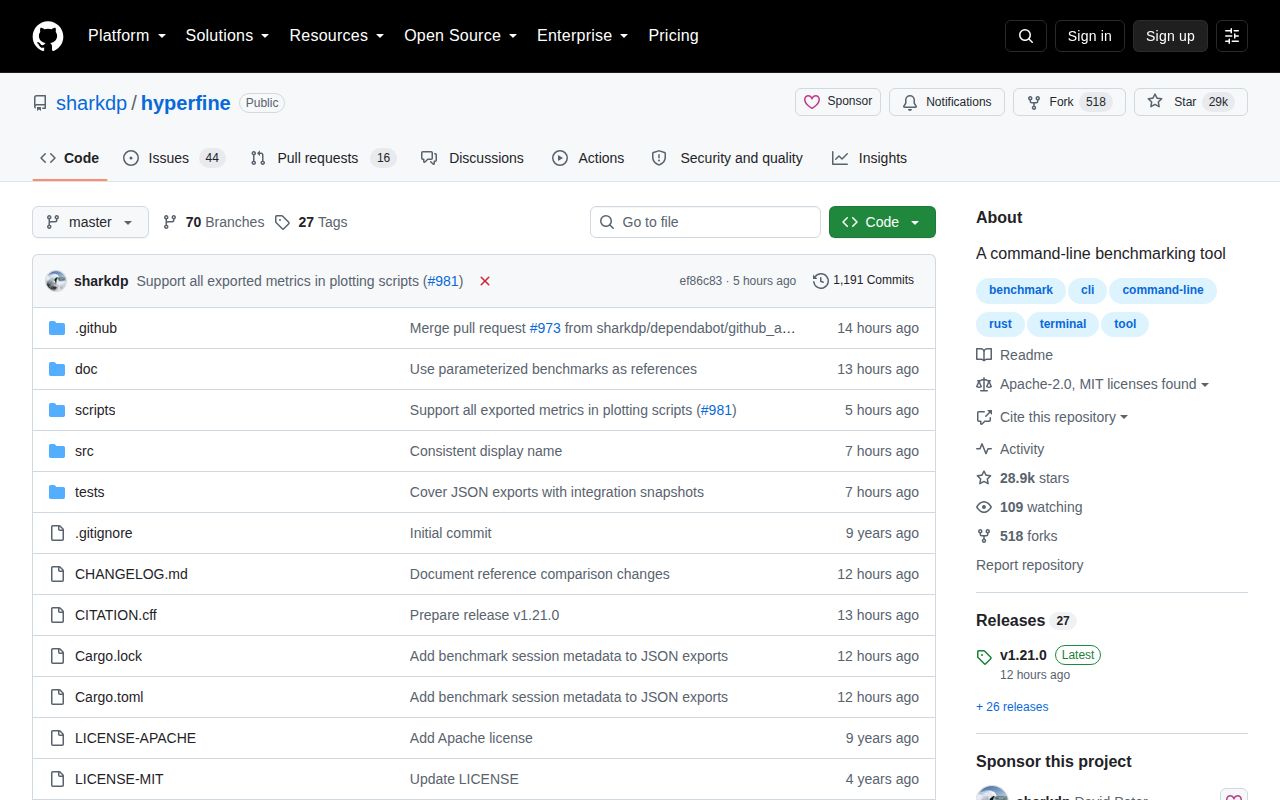
GitHub showed 28,950 stars and 60 open issues and pull requests on October 6, 2026. Release v1.21.0 shipped on October 5, and the repository was pushed later that day. The release added time-unit aliases and iteration access in preparation commands, while fixing export behavior, invalid run counts, memory reporting, Windows precision, and the included Welch's t-test script. This is current maintenance, not a dormant utility coasting on old popularity.
Some boundaries remain deliberate or unresolved. Concurrent load testing is still an open request, CPU affinity is requested, and historical saved-run comparison is not built in. Those are reasons to choose another tool for a different job, not defects in Hyperfine's main use. For local whole-command comparisons, the 238 passing tests and careful documentation make Hyperfine the first tool I would install.