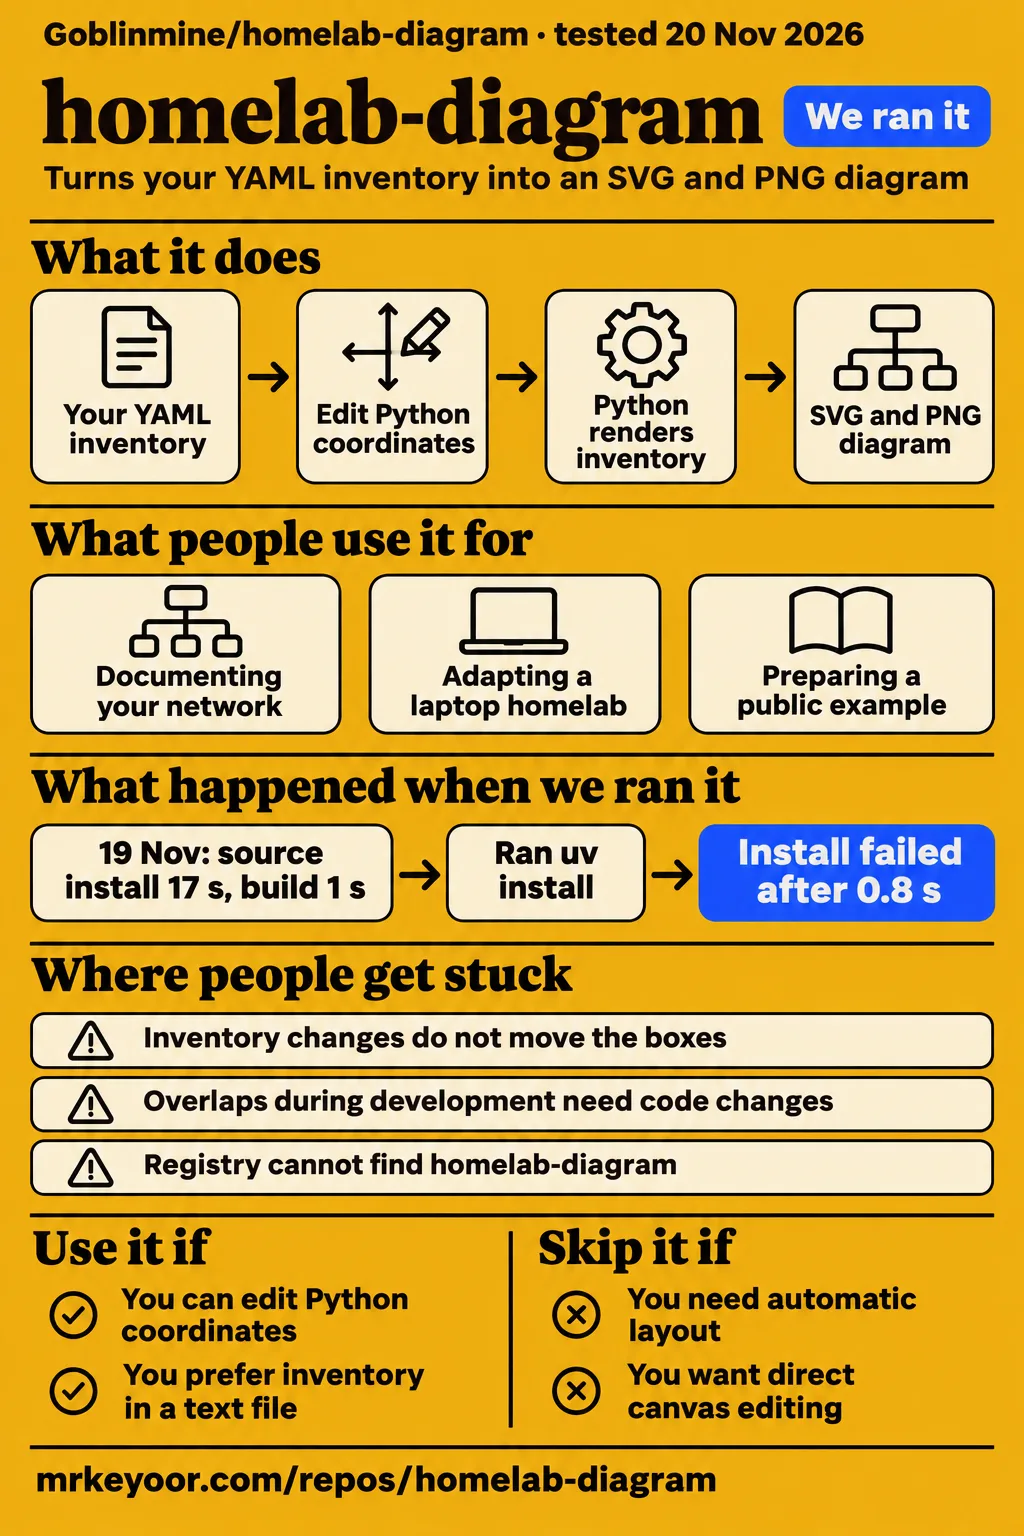
Short answer: choose it for a diagram you will edit in Python
Goblinmine/homelab-diagram renders YAML inventory into SVG and PNG using coordinates tailored to the author's network. Our source installation completed in 17 seconds and the build in 1 second. The adoption decision comes after setup: the project README tells users to move coordinates when adapting the drawing. Use it if you want this detailed visual style and can maintain the Python layout alongside the inventory. Choose another approach if automatic layout is your main requirement.
YAML is the structured text file holding devices, addresses and connections. SVG is the scalable drawing; PNG is the raster image used for sharing. Here, the inventory determines what the diagram says, while Python determines where its boxes and cables go. That separation gives you direct control over the composition, but it also makes drawing work part of maintaining the diagram. A valid inventory and a readable picture are separate results.
What people use homelab-diagram for
Goblinmine used this renderer for a published network diagram, a student reports adapting it for a laptop homelab, and the author describes preparing a reproducible public example. These are three documented uses, including two stages of the author's work. They show what people have done with the project without turning those accounts into an estimate of how quickly another network can be drawn.
- Documenting the author's network: Goblinmine identifies the project as the script behind the diagram posted on r/homelab in the project account. The author describes about 60 rounds of feedback, code changes and rendering in the development account.
- Adapting a laptop homelab: A CSE student reports using Goblinmine/homelab-diagram with Claude Code for a repurposed college laptop running Jellyfin, the arr apps and Immich in the laptop adaptation discussion.
- Preparing an example for public distribution: Goblinmine reports creating a cleaned-up copy, adding icon downloading and checking that a fresh clone rendered the posted image in the public-example account.
The laptop adaptation is evidence of reported reuse beyond the original network. The public-example account serves a different purpose: it explains how the author prepared the repository for other people to start from. Together, those uses make the project easier to assess as an editable example. Its attraction is the existing drawing conventions, including switch ports, cable widths and container cards, which another user can adapt instead of designing each element from an empty canvas.
What you can do with homelab-diagram
The README describes switch ports, VLAN markings, device addresses, virtual machines, containers and storage pools in one diagram. Its output description specifies tall bars for untagged VLANs and short bars for tagged VLANs. Cable width represents negotiated link speed, with 10G, 2.5G, 1G and 100M listed. A trunk uses a white cable with a dark core, giving the drawing another way to distinguish connections.
The server card includes a Proxmox host, virtual machines and containers outside the DMZ, TrueNAS pools, and DMZ containers with their IDs, addresses and hostnames. A DMZ is a separate network zone commonly used for exposed services. Several applications can share one container card, with a row for each application. These details explain the project's particular appearance: it combines a wiring view with information about what runs on the connected machines.
The documented usage runs uv sync, then uv run fetch_icons.py, then uv run build.py from the cloned repository. The README names out/homelab.svg and out/homelab.png as the default outputs. PNG conversion uses rsvg-convert, and the labels use Fira Sans and Fira Code. These commands describe the README workflow; the recorded build result below comes from the earlier sandbox measurement rather than a newly executed example.
What happened when we ran it
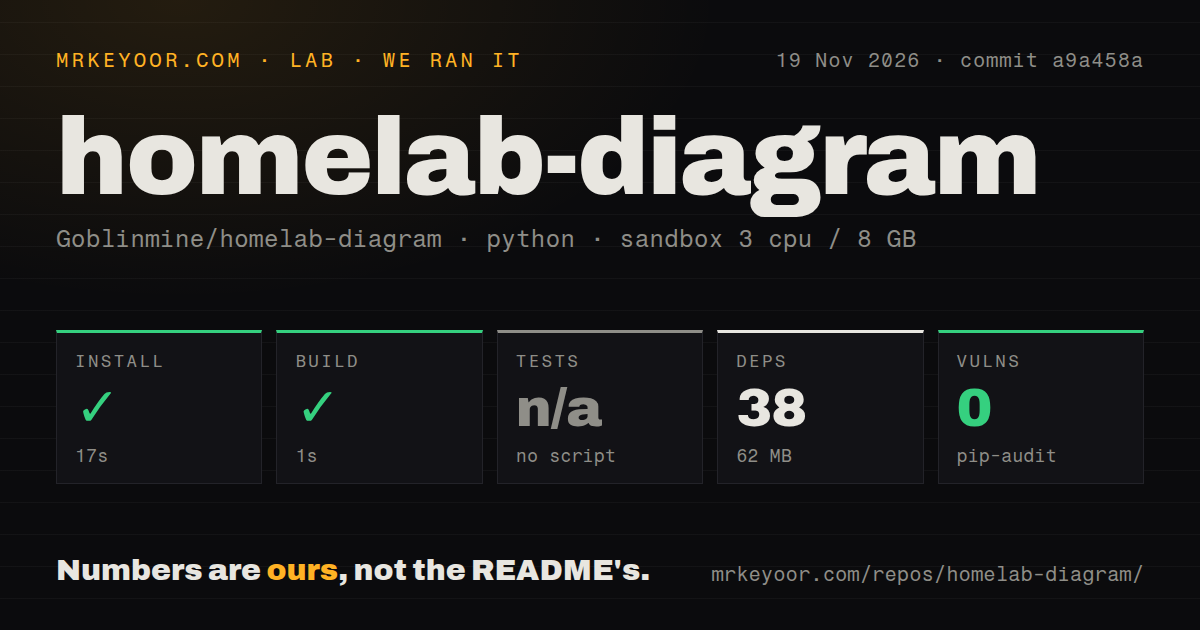
Our November 19 run at commit a9a458a recorded a successful 17-second installation and a successful 1-second build. We measured 38 recorded dependencies occupying 62 MB on disk in our sandbox run. The repository checkout contained 20 files, approximately 1,076 source lines and 2.1 MB. The configured sandbox had 3 CPUs, 8 GB RAM and image ghcr.io/astral-sh/uv:python3.12-bookworm.
| Source-run check | Recorded result | What it tells you |
|---|---|---|
| Install | Succeeded in 17 seconds | Installation completed in the recorded source environment |
| Dependencies | 38 recorded; 62 MB on disk | Recorded dependency footprint in this sandbox |
| Build | Succeeded in 1 second | The build step completed |
| Tests | No test script or target; skipped | No passing test-suite result was recorded |
| pip-audit | 0 known vulnerabilities | The audit reported no known vulnerabilities |
| Repository scan | 20 files; approximately 1,076 source lines; 2.1 MB checked out | Checkout size, separate from dependencies |
| Project signals | 0 CI workflow files; no Dockerfile; no tests directory | The scan found none of these files or directories |
The separate November 20 attempt used commit a9a458ae1824 and the quickstart-lib recipe in a fresh unprivileged container configured with 2 CPUs and 4 GB RAM, no published ports and no secrets, according to the run record. Its clone step took 1 second. It then attempted uv pip install homelab-diagram into a fresh virtual environment, taking a registry-install route rather than the README's repository commands.
The installation step failed in 0.8 seconds with exit 1. Its log named Python 3.12.12 and returned “No solution found when resolving dependencies.” The recorded reason was that homelab-diagram was not found in the package registry. Execution stopped at installation, and teardown completed successfully. That failure identifies a package-resolution problem in the attempted command; the documented starting point is the cloned repository.
Where people get stuck: content changes do not move the boxes
The README puts inventory content in inventory.yaml and hand-placed layout in build.py. Its adaptation instructions tell users to change the inventory, inspect the render and adjust coordinates when things do not fit. The top-level devices and the server card's column split both use explicit positions. Adding a device therefore involves both describing it and making room for it in the picture.
| What you encounter | Documented response | Status of that response |
|---|---|---|
| Boxes or labels do not fit | Edit inventory, inspect the render and move coordinates in build.py | README adaptation workflow |
| Overlaps during development | Inspect the PNG and zoomed crops, then revise the code | Author-described editing loop |
| Missing service artwork | Run fetch_icons.py, or add an SVG and reference its filename | README icon workflow |
| Registry cannot find homelab-diagram | Start from the documented repository workflow | The registry attempt stopped during installation |
| README presentation needs work | Issue #5 proposes documentation changes, a logo and multilingual support | Open presentation request |
The author describes Claude inspecting the rendered PNG and zoomed crops to catch overlaps in the development account. The README identifies coordinate names to search for, including fy, fh, ox, oy, bx, by and DY. Those details make the editing task more concrete: the workflow involves inspecting an image, locating the positions responsible for a crowded area, changing the code and rendering again.
Default redaction covers domains and Wi-Fi names
The README says default rendering replaces the real domain with redacted.com and gives SSIDs generic names. An SSID is a Wi-Fi network name. Its redaction description also documents python3 build.py --unredacted, which renders private output using the real inventory values. The usage examples give that output a separate homelab-unredacted filename, allowing the public and private versions to be distinguished.
The same README lists IP addresses, hostnames, hardware and exposed services among the diagram's contents. Decide which details belong in the image you intend to share, then inspect the SVG and PNG themselves. The inventory is also a separate file containing the network information used to draw those images. Keeping track of all three artifacts matters when choosing what to publish: changing a displayed domain does not change the purpose of an inventory file.
English instructions cover setup and coordinate edits
The English README documents Python 3.11+, external rendering packages, fonts, usage commands and coordinate changes. In issue #5, 01Petard requests a more conventional open-source presentation and a project logo, then suggests multilingual support. The thread is an open request. Its specific subject is presentation, while the existing README already explains the distinction between inventory content and hand-placed layout.
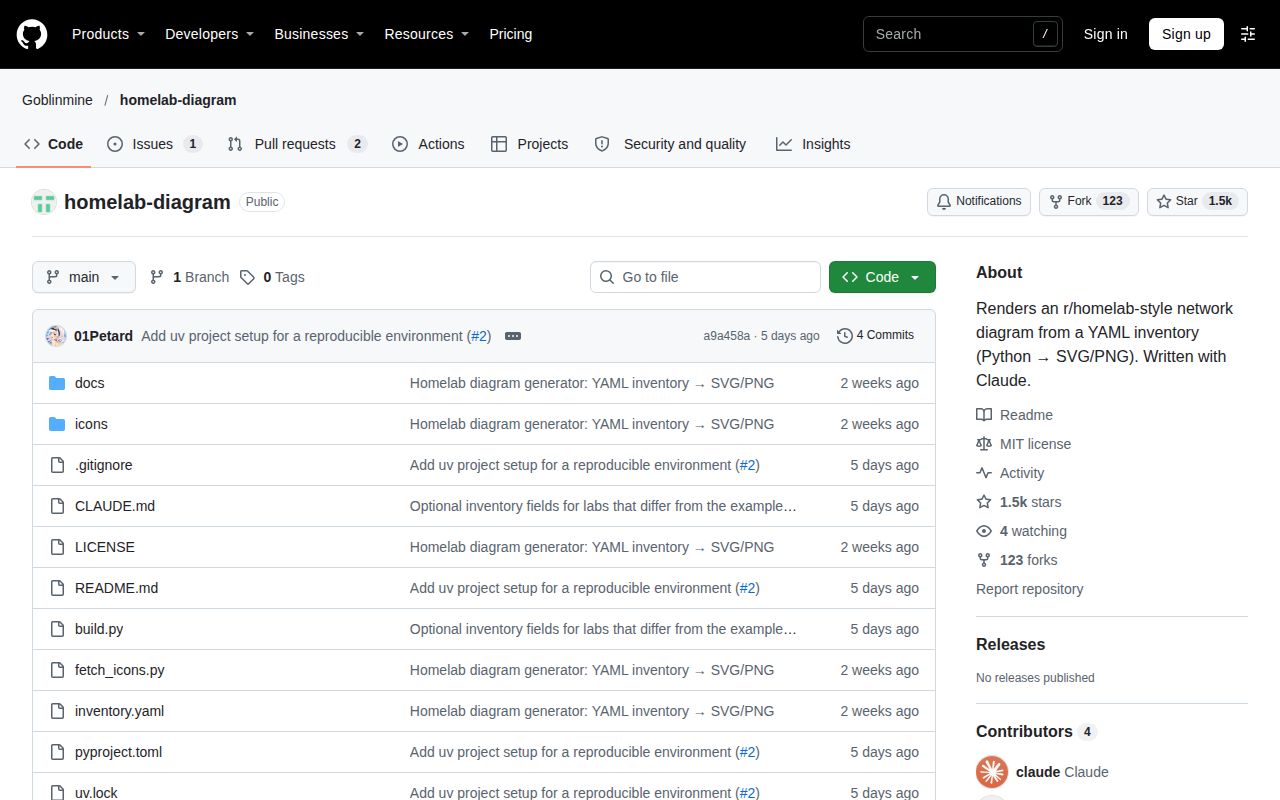
The repository metadata, observed November 20, 2026, reports 1,472 stars, a last push on November 14, 2026, and 3 open issues and pull requests combined. These are dated repository facts. For the adoption decision here, the README's layout instructions and the student's reported adaptation explain more about the work involved than a popularity count. The combined issue-and-pull-request total is not a count of three documented defects.
The credits and licence section identifies the code and included glyph icons as MIT licensed. Service logos downloaded from homarr-labs/dashboard-icons belong to their respective projects. Fira Sans and Fira Code use the SIL Open Font License and are not included. A modified diagram can therefore involve several kinds of assets, each with its own stated origin, rather than a single licence covering everything visible in the image.
homelab-diagram vs homelab-diagram-generator and draw.io
Gregdotca/homelab-diagram-generator lays YAML-defined devices out as cards grouped into sections, while Goblinmine/homelab-diagram uses hand-placed Python coordinates. The generator README describes a Go command-line tool with sections, groups and group defaults. These similarly named projects offer different layout workflows. Choose according to whether you want to adapt Goblinmine's specific composition or describe groups of devices for the generator to arrange.
| Project | How you work | Pick it when |
|---|---|---|
| Goblinmine/homelab-diagram | YAML inventory plus Python coordinates; SVG and PNG output | You want its port and server-card drawing conventions |
| gregdotca/homelab-diagram-generator | YAML devices, VLANs and services arranged as cards in sections | You prefer grouped cards to editing Python positions |
| draw.io | Drawing tools, grouped custom shapes, port connectors and zone containers | You want to arrange the diagram directly on a canvas |
The draw.io home-lab guide explains how to combine existing shapes into custom devices, label Ethernet ports and attach connectors to them. It also describes container zones whose devices move and resize with the container. That is a concrete alternative for readers who want direct manipulation of the drawing. Goblinmine's workflow instead keeps the inventory in YAML and the composition in Python, with rendered images used to judge the result.
Questions people ask
People make this particular diagram by adapting Goblinmine/homelab-diagram's inventory and Python layout, as the laptop homelab author reports. The questions below focus on choosing the renderer, understanding its inputs and maintaining the picture. They connect the diagram's appearance to the files and assets that produce it, rather than treating the network shown in someone else's image as a configuration to copy.
How do people make homelab diagrams that look like this?
The laptop homelab author explicitly credits Goblinmine/homelab-diagram, adapted with Claude Code, in the adaptation discussion. The project's own README describes changing inventory.yaml, adjusting build.py and inspecting repeated renders. That identifies both the starting point and the work involved. For this style, the reusable material includes the drawing code and conventions as well as the inventory structure; replacing device names alone is only one part of adaptation.
Can I create a homelab diagram from code or a text file?
Yes. Goblinmine's README describes a YAML inventory rendered by Python into SVG and PNG. The separate Homelab Diagram Generator also reads YAML, but arranges devices as grouped cards and writes SVG. Both let you maintain diagram information as text. Their practical difference is where layout decisions live: explicit Python positions in Goblinmine's example, versus the generator's documented sections and groups.
Which icon packs and Ethernet port templates do people use for homelab diagrams?
Goblinmine downloads service icons from homarr-labs/dashboard-icons and includes its own small hardware glyphs, according to the README's icon instructions. New SVGs can go in icons/, with their filenames referenced in the inventory. For drawing directly, the draw.io home-lab guide explains custom devices built from existing shapes, including Ethernet ports with connectors attached to them. These are two documented ways to assemble the visual elements.
How can I automate network diagramming and keep diagrams up to date?
With homelab-diagram, edit inventory.yaml and rerun the renderer; adjust Python coordinates when the changed content needs more room. The README assigns texts, IPs, ports, VLAN colours and container groups to the inventory. Its account of the original project also describes live-system checks used while gathering facts. For ongoing maintenance, the concrete documented inputs remain the inventory and drawing code, followed by inspection of the rendered image.
Should homelab-diagram's README be revised to follow a more conventional open-source project style?
Issue #5 requests that presentation change, a logo and multilingual support in the open documentation discussion. The current README already gives a clear adaptation warning: its layout was created for one network. For someone choosing the renderer, that warning belongs alongside the commands and example image because it explains why setup completion and layout completion are different milestones. The requested redesign has a different purpose from changing the renderer's layout approach.
What we have not tested yet
The successful source installation and build at a9a458a do not include an independently inspected adaptation to another network. Adaptation time, coordinate-editing effort, image reproduction and maintenance through later network changes were not measured. The student's adaptation and the author's fresh-clone reproduction are attributed reports. The November 20 registry attempt stopped before rendering. No comparison used the same network inventory across Goblinmine's renderer, the Go generator and draw.io.
The November 19 sandbox image name is configuration metadata, not proof of its actual Python or operating-system version; those require raw toolchain logs. Cross-platform setup, Windows compatibility, larger-inventory readability, automatic discovery and continuous synchronization were not assessed. Complete removal of private values, icon-download traffic and renderer or agent security were not audited. The 0-known-vulnerability pip-audit result covers its recorded audit scope. The next useful evaluation is an inspected rendering of your own inventory at the size you intend to share.