Short answer
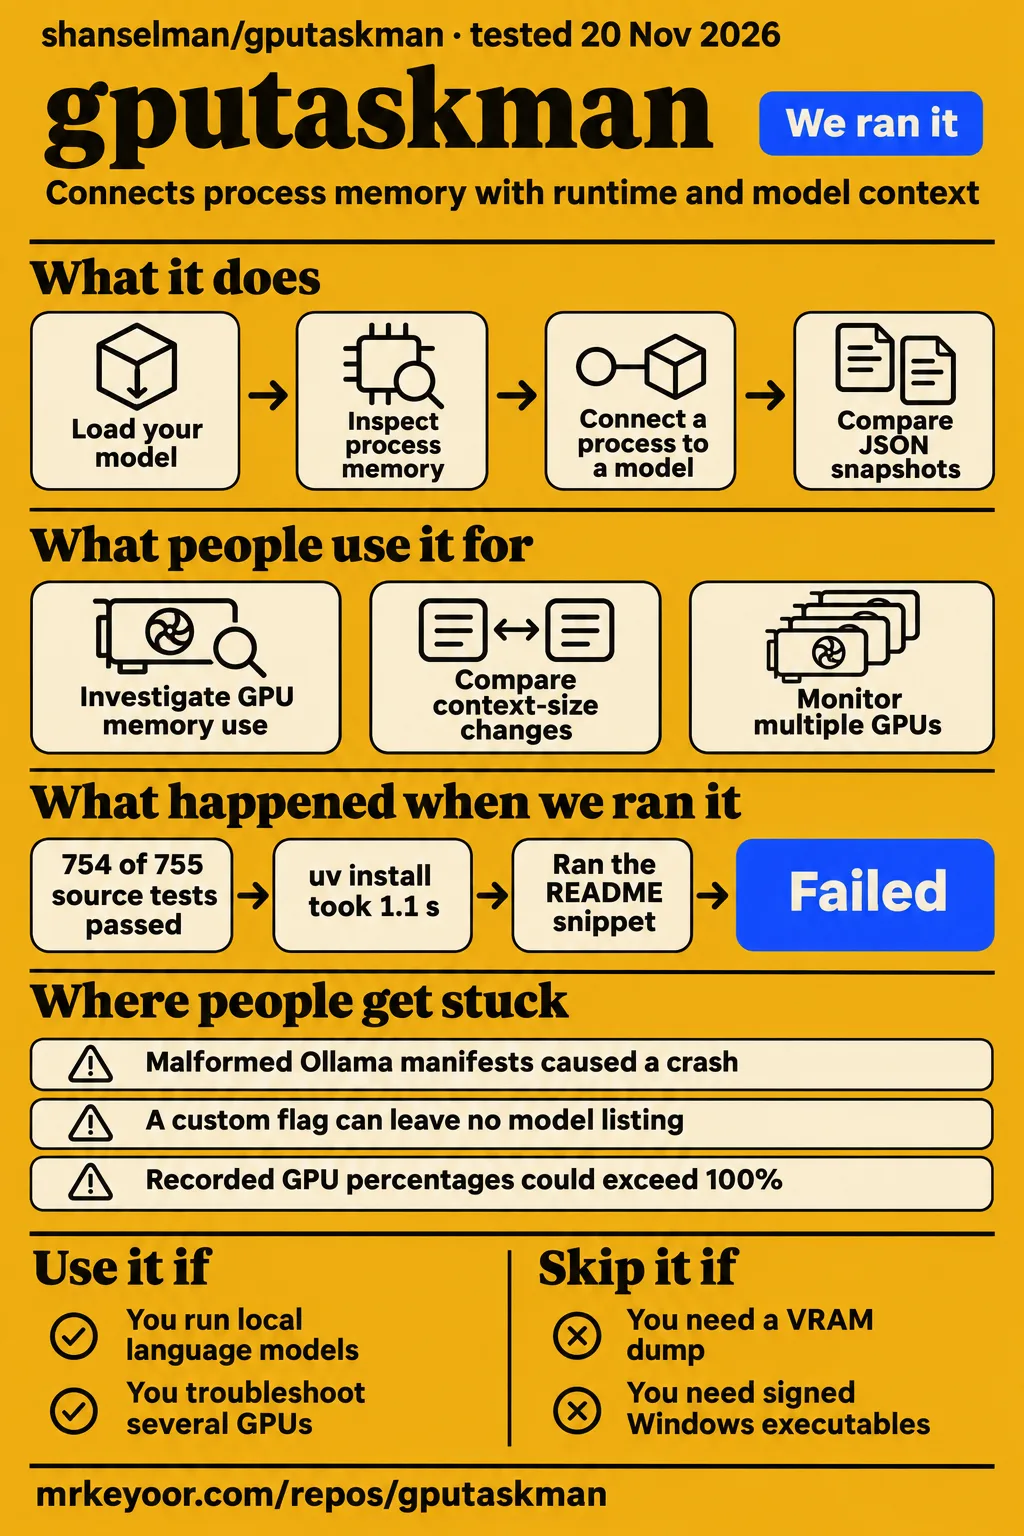
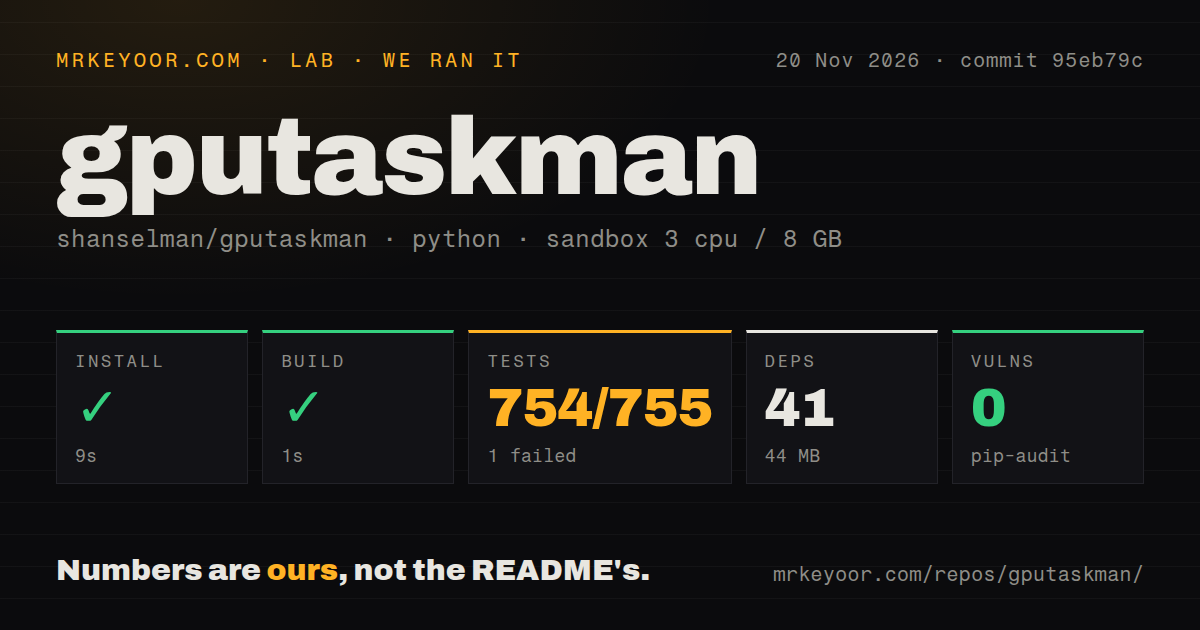
Our run installed gputaskman in 9 seconds and built it in 1 second, then the test command failed with 754 passing tests and one failure. Use it if you run local AI models and want process memory readings connected to model files and runtime information. Skip it if you need a texture-level explanation of a game's VRAM: the project's documentation explicitly excludes that job. The useful purchase decision here costs no money, but it does cost your attention: do the model clues answer a question your existing monitor leaves open?
Windows Task Manager already has per-process GPU memory. gputaskman's appeal is the explanation beside the reading, especially for a local language-model server. Its README separates measured counters from estimated model breakdowns, and Ty Sherback's XDA hands-on review shows that extra context in use. Keep that distinction when deciding which numbers to act on.
What people use gputaskman for
gputaskman connects process GPU memory and activity to runtime and model evidence in a terminal interface, according to the project documentation. VRAM means a graphics card's video memory. A runtime is the software layer doing the work, such as CUDA or llama.cpp. For a local large language model, the interesting question is often why its process consumes more memory than the model file occupies on disk.
The inspector can connect a process with a model and explain weights, KV cache and compute buffers. Weights are the model's learned values; KV cache stores attention data used during generation. In Sherback's llama-server inspection, the breakdown came from runtime logs. Without those logs, he describes the KV figures as estimates derived from model metadata. A number that explains an allocation is more useful when you also know how the program obtained it.
For a repeatable investigation, the README documents JSON snapshots and a before/after diff. Save a snapshot, load your model, send one request, then save another and compare them. The comparison keeps measured memory changes separate from runtime-reported segments and estimates. That's a sensible way to investigate a context-size change without treating a model's theoretical cache budget as memory it necessarily consumed.
Users have reported model inspection, mixed-vendor discovery and compute-only NVIDIA monitoring, with different levels of corroboration.
| Who used it | What they did | What came back |
|---|---|---|
| XDA reviewer Ty Sherback | Loaded Qwen3-8B on a Radeon RX 9070 XT | Reported 7.37 GB used overall, with 1.37 GB against dwm.exe and 1.14 GB against Brave. These process readings are not a claim of exclusive ownership or an additive total. |
| XDA reviewer Ty Sherback | Selected llama-server in the inspector | Reported 4.35 GB weights, 576 MB KV cache and 108 MB compute buffers from llama.cpp logs. |
| GitHub user gamedevsam | Tried the multi-GPU update alongside a home-grown monitoring dashboard | Confirmed that all GPUs appeared, including the integrated GPU, then requested a less crowded view. |
| GitHub user cmillsap | Checked a Windows desktop with two NVIDIA cards and a Radeon integrated GPU | Reported that v0.3.3 listed all three adapters and JSON output worked for each. |
| GitHub user etaduck | Ran llama.cpp on a headless P102-100 in Windows TCC mode | Posted a v0.4.2 llama-server row showing 9.51 GB. The triage reply explicitly separates this report from an independent nvidia-smi comparison. |
Sherback's desktop is the most relatable example if you mix local models with ordinary PC use. The compositor and browser appeared beside the model, giving him specific processes to investigate before blaming the model's size. His allocation breakdown also answers a more technical question: the model file's weight size is only one part of a server's memory requirement. Those are his hardware observations, rather than results from our sandbox.
The TCC report took two steps. First etaduck posted an idle snapshot with the P102-100 detected and an empty process table. A triage agent asked for a workload snapshot; etaduck then posted the llama-server row. That sequence supports a stronger conclusion about process reporting than the idle screenshot alone, while keeping the accuracy question separate.
What happened when we ran it
Our sandbox run installed gputaskman in 9 seconds, built it in 1 second and failed the test step after 60 seconds. We checked commit 95eb79c on November 20, 2026, with a recorded configuration of 3 CPUs, 8 GB RAM and image label ghcr.io/astral-sh/uv:python3.12-bookworm.
| Check | Our recorded result |
|---|---|
| Dependency installation | Succeeded in 9 seconds; 41 dependencies recorded; 44 MB on disk |
| Build | Succeeded in 1 second |
| Tests | Exit 1 after 60 seconds; log summary: 754 passed, 1 failed, 6 skipped, 514 subtests passed |
| Dependency audit | pip-audit reported 0 known vulnerabilities |
| Repository scan | 70 files, approximately 23,694 source lines, 2.6 MB checked out |
| Automation signals | 2 CI workflow files, a tests directory, no Dockerfile detected |
Installation and build completed. Then pytest reached test_current_inferred_vram_sets_first_sample_scan_priority in tests/test_wslhost.py and failed an assertion: PID 25 appeared in the scan-call list even though the test expected it to be absent. The actual list began with PID 26 and ended with PID 25. The failure concerns which processes received a deep scan on the first sample; the log alone doesn't identify the cause or demonstrate a broken hardware monitor.
The pytest tail gives 57.31 seconds for the suite, while the harness records 60 seconds for the test step. Its passing and failing counts are clearer than its headline denominator: the parser says “of 755” while also listing six skipped tests, so the table preserves the log's separate counts. A successful build and hundreds of passing tests are useful contributor evidence, but the suite wasn't green.
A separate November 20 quickstart attempt used an unprivileged container. Its automation selected a library-style recipe and stopped because the README had no Python code block to run. That is a recipe mismatch for a terminal application, rather than evidence that the documented CLI failed. The teardown record says cleanup completed. The installation figures above all come from the source-check harness; they are not blended with that separate attempt.
Where people get stuck
The most actionable reports concern malformed Ollama manifests, unfamiliar model flags and GPU recovery after a driver-state change.
| Symptom | What the reporter found | Resolution or next step in the thread |
|---|---|---|
| Opening an Ollama model closes the monitor | bitli's issue #33 reports TypeError: 'NoneType' object is not iterable. A triage agent reproduced a manifest with layers: null. |
The merged fix skips malformed manifests. bitli said v0.4.0 worked, while allowing that the Ollama store might also have changed. |
| A large consumer has no model listing | RAFOLIE's issue #48 describes Strata passing a GGUF file under --native. |
RAFOLIE confirmed the correct path appeared with path-arg provenance after updating to merge commit ef599e5. |
| Re-enabled laptop GPU stays absent or loses telemetry | raenye's follow-up in issue #7 reports rapid rediscovery in v0.3.4. | The card came back, but the tester also saw the message requiring a gputaskman restart to restore NVIDIA telemetry. |
| Intel shared memory is labelled as VRAM | win7guru's issue #35 led to integrated-memory and activity changes. | The triage agent says the fixes shipped in v0.4.1; later v0.4.3 snapshot interpretation reports Iris Xe activity and shared memory. |
The Strata fix is particularly useful if you run a less familiar server. A valid model path passed under a custom flag is a clue, but it says less than a model-specific flag the monitor recognizes. The new label preserves that difference. RAFOLIE also corrected the original report: the process did have a CUDA runtime tag; it lacked a recognized AI-framework tag. Repeating the initial “no runtime” description would misstate the outcome.
If the full diagnostic screen is too crowded, the documented m shortcut switches to slim monitoring for the session. gamedevsam's complaint in issue #7 was about static details taking attention away from monitoring. You can keep a deep inspection view for troubleshooting and use the quieter display while watching a workload.
Long recordings need a counter sanity check
Madhur-Prakash checked a summary against an eight-hour training recording and found matching calculations, while the recording itself contained extreme process GPU percentages.
In issue #68, Madhur-Prakash reports that the sample count, time span, averages, peaks and top processes matched their own summary. The file held 2,930 samples from a Windows 11 system with an RTX 4060 Laptop GPU. That is a concrete user check of the summarizer's arithmetic on one saved file, rather than a measurement of gputaskman's overhead or its effect on training speed.
The same report identifies 15 process rows with GPU activity around 18,450,000,000,000%. The triage reply says the summary change merged and a column-overlap problem was fixed, then asks for a separate issue about the suspected counter wraparound. It does not report that anomaly resolved. A summary can faithfully calculate a peak from bad input.
The current README describes rejecting non-finite, negative or above-1000% Windows process-engine counters, making those readings unavailable. That documented safeguard is a separate fact from the historical recording. If your saved file contains impossible peaks, inspect the underlying samples before using its summary to describe a training run.
Security starts with the executable and the snapshot
The project documents unsigned Windows portable builds with checksum companions, and monitoring requires no API key or model download.
For the portable Windows route, the README says to extract the entire ZIP and keep _internal beside the executable. Choose the native x64 or ARM64 build for your machine. A checksum helps check the downloaded file's integrity; it does not supply the publisher identity of a signed executable. If your employer requires signed software, that distribution detail can settle the decision before any GPU feature does.
Our dependency audit reported zero known vulnerabilities. That result covers the audit performed in our sandbox, rather than the safety of every executable, driver interaction or future dependency revision. Snapshots can contain process and model-path information: the recording discussion specifically asks for affected lines with paths removed. Apply the same care before attaching your own diagnostic file to a public issue.
gputaskman vs Task Manager, nvidia-smi and nvtop
Task Manager already supplies per-process GPU memory; gputaskman adds workload and model context around those readings.
| Alternative | Pick it when | Reason to consider gputaskman instead |
|---|---|---|
| Windows Task Manager | You need to identify a process's GPU memory without another application | Sherback explains that Details has a Dedicated GPU memory column, while gputaskman adds classification and model inspection. |
| nvidia-smi | You want NVIDIA's device and process tooling | Windows WDDM can leave process memory unavailable through NVML; TCC uses a different reporting path. gputaskman combines platform counters with model context. |
| nvtop | You want a terminal GPU monitor across supported vendors | nvtop's README documents multiple GPUs and vendor-specific backends. gputaskman's particular attraction here is local-model evidence, the distinction identified in Remio's comparison. |
If your question is simply which program is touching the GPU, BetaNews describes NVIDIA's GPU Activity taskbar icon as a simpler list. Start with the information you need. Installing a more detailed monitor pays off when the runtime or model inspector changes what you'd investigate next, rather than just giving you another utilization chart.
What the other reviews get wrong
Several launch stories overstate Task Manager's blind spot or repeat requirements that later documentation contradicts.
Questions people ask
You can inspect which processes use GPU memory, then use gputaskman's runtime and model clues to investigate what those processes are doing. The README distinguishes those clues from measured counters.
What is actually using my GPU memory?
Task Manager's Details view can already show dedicated GPU memory by process. Sherback's review shows how gputaskman adds workload categories and a model inspector, useful when a server's memory requirement includes cache and buffers alongside weights.
Does gputaskman support Intel GPUs on Windows, including Iris Xe?
Yes: win7guru posted Iris Xe exports and a Copilot triage agent interpreted v0.4.3 snapshots as showing detection, 2-3% activity and roughly 727-728 MB shared memory. The agent explicitly warns that spreadsheet values differed. Intel temperature, power and clocks remain unavailable on Windows in that thread.
Can gputaskman monitor all GPUs in a multi-GPU system?
Yes: gamedevsam confirmed all their GPUs appeared, and cmillsap reported two NVIDIA cards plus a Radeon integrated GPU in v0.3.3. cmillsap also checked JSON output for each adapter. These are reports on particular machines, rather than a guarantee for every combination of drivers.
Why does a GPU disappear after I disable and re-enable it?
An older adapter-discovery problem is described in raenye's issue #7 follow-up. Their v0.3.4 retest found the GPU quickly after enabling it, but NVIDIA telemetry still requested a monitor restart. Device rediscovery and telemetry recovery are separate outcomes.
Why does gputaskman miss a Windows TCC-mode NVIDIA card that nvidia-smi can see?
TCC is NVIDIA's compute-only driver mode; the original issue #14 explains that these cards were missing from the Windows display-adapter enumeration. The NVML-only path shipped in v0.4.2, and etaduck subsequently posted P102-100 detection and a running llama-server row.
Why does opening an Ollama model crash gputaskman?
A malformed model-store manifest caused the NoneType crash in bitli's issue #33. The fix skips a manifest whose layers value is null. bitli reported success with v0.4.0, with the qualification that their store may also have changed. That specific report is a useful match for that traceback, not a diagnosis of every Ollama crash.
Why does my biggest GPU-memory consumer show no model when its launch command includes a GGUF path?
A custom model flag can escape the recognized flag list. In issue #48, RAFOLIE confirmed that the Strata --native path appeared after merge commit ef599e5. The path-arg label means the path was passed at launch, a weaker clue than a recognized model flag.
Does gputaskman support Windows 7, Windows 8 or older Windows Server releases?
The README targets 64-bit Windows 10/11. In issue #55, Hanselman declines Windows 7 support and notes Python 3.11's incompatibility. A commenter links a separate port; that isn't upstream support for older desktop or Server editions.
Can I install gputaskman from PyPI with pipx or uv?
Yes: the README documents pipx install gputaskman and uv tool install gputaskman, followed by the gputaskman command. The PyPI request in issue #4 ends with Hanselman linking the published package.
Can I run gputaskman on Windows without downloading Python?
Yes: the portable Windows ZIPs contain an executable and its supporting files. Extract the whole archive, retain _internal, and choose x64 or ARM64. The distributions are unsigned.
Is there a slim monitoring mode that hides static diagnostic details?
Yes: the documented m toggle switches between full diagnostics and slim monitoring for the current session. That option follows the information-overload complaint in gamedevsam's multi-GPU discussion.
Can gputaskman summarize a saved recording?
Yes: issue #68 records the merge of gputaskman summary and Madhur-Prakash's check against their own calculations. Inspect suspicious source percentages before accepting the peak GPU figure in a saved file.
What we have not tested yet
Our sandbox checks establish installation, build and test outcomes at 95eb79c, not GPU-counter accuracy on real hardware. We did not reproduce the XDA workload, compare the TCC readings against nvidia-smi, or run the Intel and mixed-vendor machines described by users. The configured image label does not establish actual Python or operating-system versions; those require the raw toolchain logs.
We have no measured CPU overhead, idle RAM use or workload-performance penalty for the monitor. The terminal interface alone cannot substantiate a tiny-footprint claim. Nor do GitHub attention or a dependency audit establish broad adoption, executable safety or reliable operation over weeks. The r/pcmasterrace discussion contains sharply different opinions rather than a reproducible workload, the r/gpu link has no comments, and preprintpigeon's X reply explicitly says there was no test by them. The Bilibili search result lists a gputaskman video, but contains no transcript from which to judge its demonstration.
The recording thread leaves the extreme-percentage anomaly unresolved; the current README's rejection rule still needs a controlled reproduction against that case. We also have no fresh hardware check of the README's revised container PID attribution: it labels order-based local matches as guesses and separates measured host rows. Those boundaries matter if you share a GPU between containers. For your first investigation, preserve the snapshot, the driver version and the model's launch arguments together so that an unexplained reading can become a reproducible issue.