BrowserTools reads the Chrome session you are already debugging
Most browser agents start a separate profile. That is useful for repeatable tests, but inconvenient when the bug depends on the session already open on your screen, complete with login state, feature flags, and the exact page history that produced it. BrowserTools takes the opposite approach. Its extension captures the active DevTools session and sends structured console, network, page, storage, screenshot, and audit data to a local MCP server.
The server exposes 16 tools plus resources for full console history, network history, HAR files, screenshots, and Lighthouse reports. Reads can be filtered and paged, and each result identifies its tab and URL. Several tabs can stay connected at once. This is a better debugging shape than pasting screenshots and console fragments into chat, because the agent can ask a narrower follow-up while the original evidence remains addressable.
The extension solves login friction but expands the trust boundary
Chrome 136 refuses remote debugging against the default profile unless a nonstandard data directory is used. BrowserTools avoids that limitation by using an extension inside the real session. The payoff is immediate: the developer does not have to recreate authentication in a disposable browser. The cost is equally clear: an AI client can inspect data produced by tabs that may hold customer records, internal APIs, or privileged cookies.
Version 2.x confines the connector to loopback, authenticates HTTP requests with a per-run token, checks extension origins, and disables headers by default. Cookie access is optional. Credential patterns are scrubbed in the browser and again on the server. The security policy still calls redaction best-effort, because a bespoke secret format can escape a pattern matcher. Sensitive organizations should restrict captured tabs and exposed tools rather than treating [REDACTED] as a complete data-loss control.
What happened when we ran it
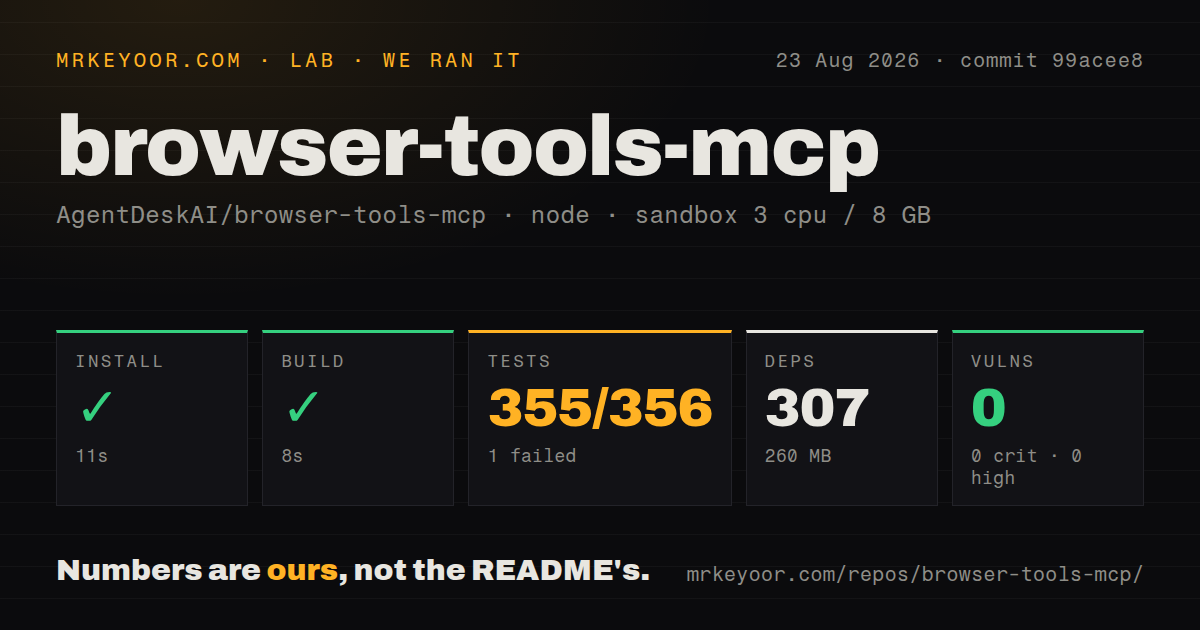
Our sandbox cloned commit 99acee8 with 3 CPUs and 8 GB of RAM. Npm installed 307 packages in 11 seconds and occupied 260 MB. The monorepo build succeeded in 8 seconds. Npm audit found 0 known vulnerabilities across the installed dependency tree.
Vitest finished with exit code 1 after 17 seconds: 355 tests passed and 1 failed out of 356. The failing integration case created an attachment runtime on port 1 and expected runtime.degradedReason to be truthy. It was not. The next assertion would have checked that tool calls explain the unavailable runtime, but the first expectation stopped the case. The log does not show whether the cause is environmental or a product defect, so we do not assign one.
The checkout contained 77 files, roughly 12,849 lines of source, and 0.7 MB before dependencies. Our scan found one CI workflow, npm workspaces, no Dockerfile, and no conventional tests directory. The repository nevertheless contains test files under package-specific paths, which is how Vitest found 356 cases. The installed 260 MB footprint is large relative to the source, largely reflecting browser and audit tooling rather than repository size.
Capture begins at DevTools open, not at page navigation
The extension starts capture when DevTools opens. Requests that completed earlier are missing, so a full page-load diagnosis begins by opening DevTools and reloading. Each tab with DevTools open keeps its own retention buffer, and the most recently opened panel becomes the current target. An explicit tabId removes ambiguity when several sessions are active. Console wrapping can avoid Chrome's debugging banner, although screenshots still depend on the DevTools route.
Screenshots have a default 3 MB budget. Oversized images are converted to JPEG and downscaled, or stored on disk when they still cannot fit the transport. Large histories stay behind MCP resource links instead of flooding every response. Those decisions show attention to context cost. They also mean the agent may receive a reduced image or a summary until it deliberately opens the full artifact.
Lighthouse audits are useful diagnostics, not browser tests
Accessibility, performance, SEO, and best-practices audits are available through the same server. They launch a separate Chromium process rather than auditing the live extension tab in place. Release v2.0.2 fixed a mismatch where audits could use desktop viewport settings with mobile throttling and then report a hardcoded device. The release also corrected HAR start times, event ordering, log retention, and selected-element scrubbing.
That release landed on August 12, 2026, the same date as the latest repository push. GitHub showed 1 combined open issue and pull request, a feature request for optional paid API support. A small queue plus a fresh release suggests active maintenance, while the unusually candid security history gives buyers something more useful than a generic safety claim.
Upgrade every 1.x installation before evaluating features
The security policy assigns the 1.2.x line a critical advisory with a 9.8 score. The old connector listened beyond loopback, lacked authentication, and allowed untrusted WebSocket input to reach a shell command. Version 2.0 removed the network scan and shell path, added origin and host checks, and rewrote the extension protocol. Old and new extensions are incompatible, so an upgrade also requires reinstalling the unpacked extension.
For current users, BrowserTools fills a specific gap well: show an agent the browser state a developer is already seeing. It is less suitable as a test runner or remote browser platform. The 355 passing cases, clean audit, documented limits, and 2.x security redesign justify a trial. The remaining question is organizational rather than technical: whether a live authenticated browser belongs inside the agent's evidence boundary.