Breakscale turns static diagrams into deterministic experiments
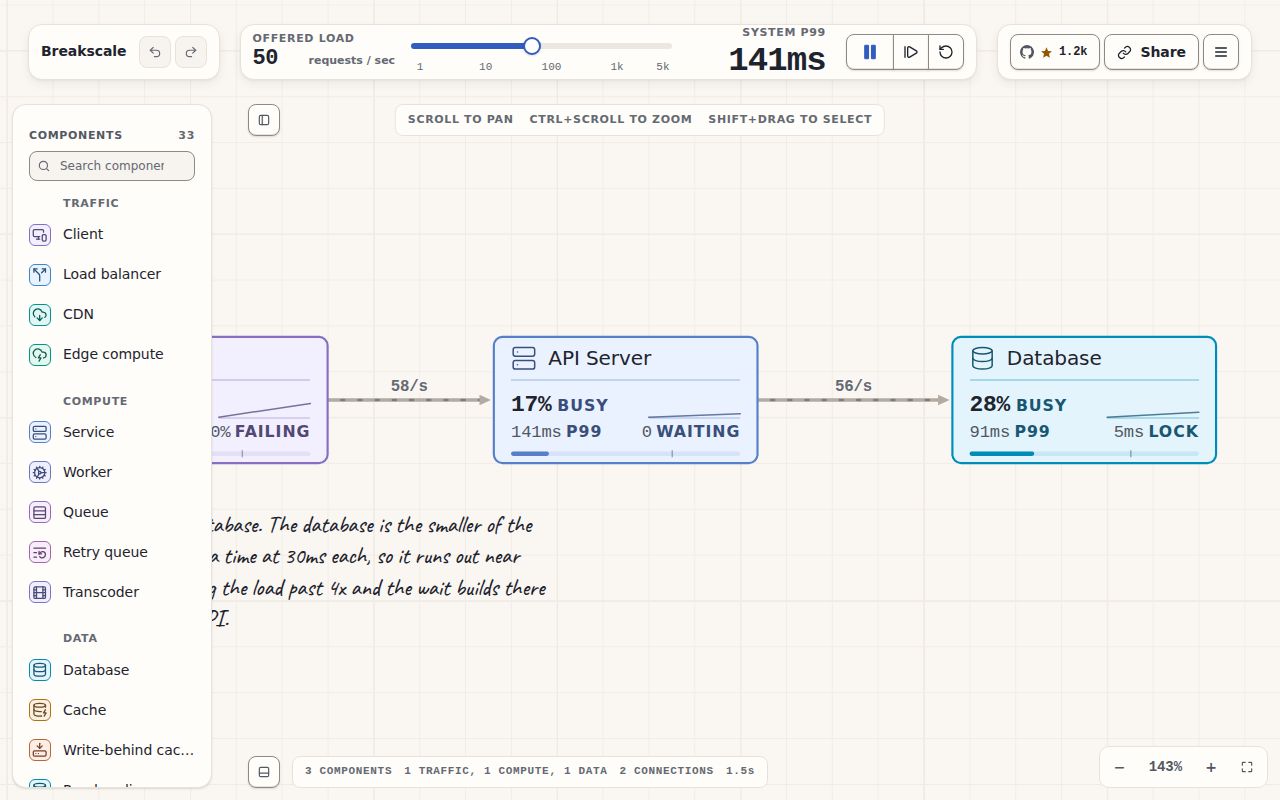
Breakscale lets you place services, databases, queues, caches, and failure controls on a canvas, then raise traffic until the design behaves badly. The README lists 33 component types and 23 worked examples. Sixteen isolate teaching scenarios, while 7 reconstruct published architectures from companies such as Netflix and Stripe. Each reconstruction states that it is a teaching diagram with named omissions, not inside knowledge.
The useful change is motion with accounting. Requests are objects moving through a discrete-event engine, finite worker slots produce FIFO queues, and abandoned downstream work keeps consuming capacity after a caller times out. Service times come from a gamma distribution rather than one fixed delay. The engine measures p50, p95, and p99 from completed requests, so a retry storm can show high database use alongside zero useful completions.
What happened when we ran it
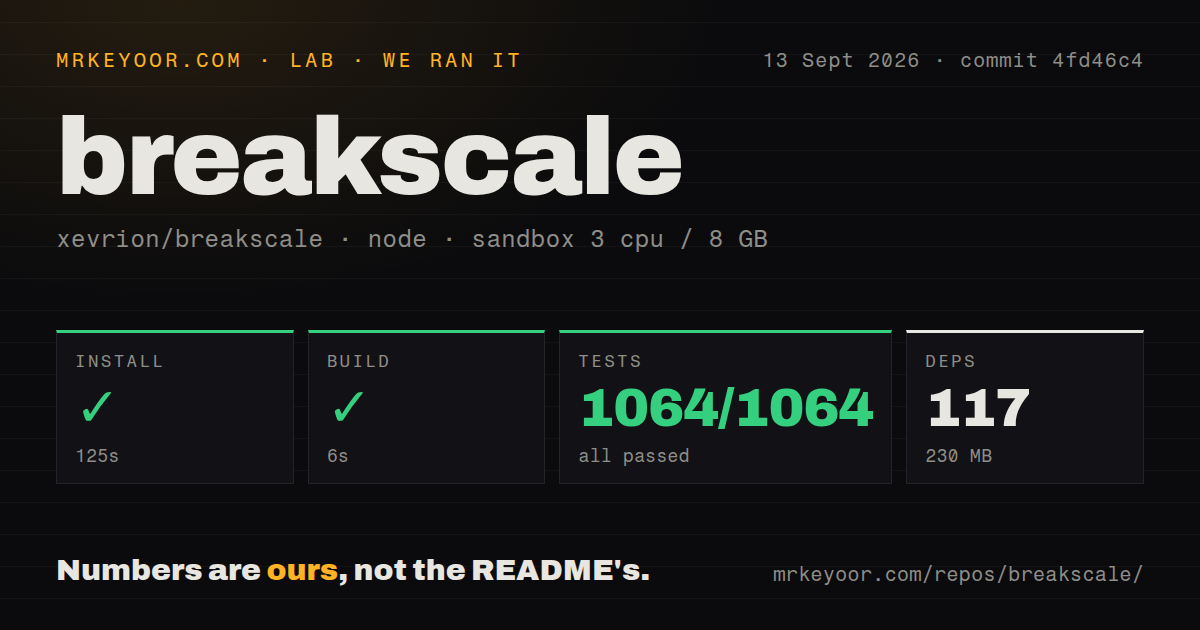
Our sandbox installed Breakscale in 125 seconds, pulling 117 packages and using 230 MB on disk. The build completed in 6 seconds. Vitest then finished in 21 seconds with 1,064 passed and 0 failed. That clean run matters for a teaching tool whose numbers are the product, and it gives a buyer a much stronger starting signal than a screenshot of the canvas.
The measured commit was 4fd46c4. Its checkout held 192 files, about 47,297 lines of source, and only 2.6 MB before installation. We found 3 CI workflow files and no Dockerfile. There was no dedicated tests directory, but the repository's actual Vitest target existed and passed. The lab result covers the available automated suite, not the accuracy of every model against a production incident.
The browser path is private, while shared designs leave the machine
Local use needs Bun and bun dev, which starts the Vite application on port 5173. The simulator runs in the browser without an account. According to the README, a design remains on the machine unless you share it. Shared designs are encrypted in the browser before storage, and the decryption key lives in the URL fragment that browsers do not send with the request.
That setup makes Breakscale easy to put in front of a class or a design-review group. It does not provide a shared workspace with roles, comments, or live cursors. Exported files and encrypted links are the collaboration mechanism described by the project. If the topology contains company-sensitive names or assumptions, review what the share action stores and where before treating client-side encryption as an organizational approval.
Hardware choices do not yet produce a capacity plan
Issue 29 draws a firm boundary around the simulator's sizing panel. It says priced size catalogs exist for only 3 component kinds, and designs containing unpriced workers can show monthly totals that omit them. The report also says memory, network, and maximum IOPS appear as specifications but do not affect results. Only virtual CPU count currently feeds a derived capacity value.
That makes the tool useful for comparing queueing behavior under stated assumptions, not for deciding which cloud machine to buy. A learner can change capacity and observe the consequence. An infrastructure team cannot enter an on-premises server, model memory exhaustion, or expect a selected network figure to slow traffic. Breakscale is honest enough to leave many values unset, but a polished cost panel can still look more decisive than the model underneath it.
Cache chains expose one documented modelling limit
The engine covers retries, circuit breakers, queues, autoscaling delays, sharding, and chaos controls. The 23 examples make those ideas inspectable without turning the exercise into a production outage. Deterministic seeds also help: the same topology and seed replay the same way, which is useful when two students compare why one change helped.
Open issue 31 shows where visual plausibility can outrun system semantics. Three generic caches with an 80 percent hit rate each perform independent rolls, reducing a 50 RPS test to about 0.4 RPS at the database. The report explains that real cache tiers depend on shared keys, content overlap, admission, and eviction. Until the model gains those semantics or a warning, stacking caches can teach the arithmetic of independent filters rather than a realistic hierarchy.
The 1,064 tests protect numbers better than pixels
The README says the suite checks request conservation, failure totals, utilisation bounds, and invalid numeric fields. Our run confirms that 1,064 tests passed. Issue 14 identifies a different hole: none of the existing tests would catch panels in the wrong place, overlapping annotation plates, or theme-specific geometry errors. Pull request 73 was open with a proposed visual-regression fix when we checked.
Repository activity is current. GitHub recorded the last push on September 14, 2026, alongside updates to feature and dependency pull requests. The project had 1,156 stars and 14 combined issues and pull requests. It was created on August 23, so that activity belongs to a young codebase rather than a long maintenance record. The latest-release endpoint returned no published GitHub release, which does not cancel the fresh commits or issue work.
Use the simulator to choose what to test for real
Breakscale's best output is a sharper hypothesis: retries may erase goodput, a queue may move rather than remove delay, or one shard may fail while the average looks fine. The 6-second build and complete 1,064-test pass make it easy to recommend for that job. When the question becomes whether your own API survives 500 requests per second, move to k6. When failure tolerance needs proof in deployed infrastructure, a chaos tool belongs in the loop. The simulation should decide which experiment to run, not stand in for its result.