@visx/curve review
@visx/curve 4.0.0 re-exports 18 D3 curve factories through @visx/vendor. Pass one to the curve prop of @visx/shape's LinePath or another compatible path generator to choose linear, stepped, monotone, basis, bundle, cardinal, Catmull-Rom, or natural interpolation. Version 4 adds package-root exports for require and import, strict ESM output, modern browser targets, and D3 shape 3 underneath. The package contains no React component, scale, axis, tooltip, animation, or accessibility layer. Our full browser import measured 14.7 KB minified and 2.5 KB gzipped.
@visx/curve 4.0.0 installed in 4.4 seconds, used 6 MB across 28 packages, bundled to 2.5 KB gzipped, and returned 0 audit findings in our sandbox. Add it beside @visx/shape for visx-aligned D3 interpolation; install d3-shape directly outside visx, or choose a full chart library when curves are only one missing piece.
We installed it
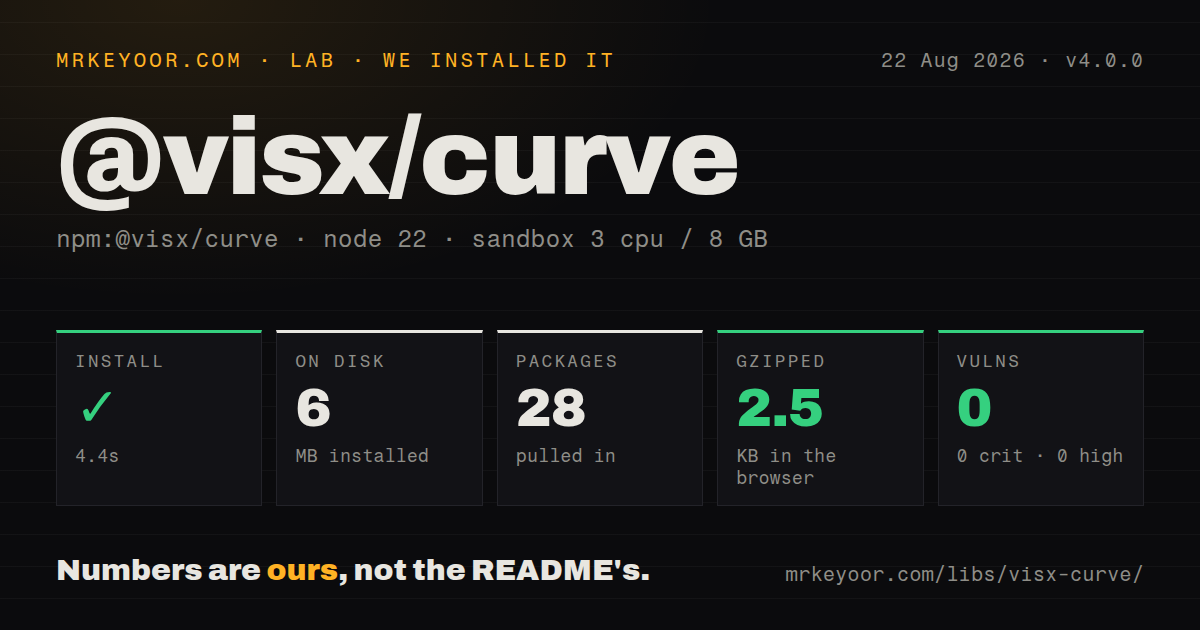
| Install | ✓ · 4.4s | 28 packages on disk · 6 MB |
| Import | ✓ | ESM import works · require() works · CommonJS package with exports map |
| Browser | 2.5 KB | gzipped (14.7 KB minified), bundled with esbuild |
| Types | ✓ | TypeScript types bundled |
| Known vulns | 0 | 0 critical · 0 high · 0 moderate · 0 low (npm audit) |
Answers from our run
Does @visx/curve install cleanly?
Yes. In a fresh container with an empty cache, npm install @visx/curve finished in 4 seconds, leaving 28 packages and 6 MB on disk. npm audit reported no known vulnerabilities.
How much does @visx/curve add to a browser bundle?
2.5 KB gzipped (14.7 KB minified) when the whole package is bundled for the browser with esbuild. Importing only part of it is usually smaller.
Does @visx/curve work with both ESM and CommonJS?
Yes. Both import '@visx/curve' and require('@visx/curve') worked in Node 22 in our run. The package is published as CommonJS with an exports map.
Does @visx/curve include TypeScript types?
Yes, type declarations ship inside the package, so no @types install is needed.
@visx/curve or d3-shape: which should you use?
d3-shape: Use it directly outside visx or when the same module should also provide line, area, arc, pie, stack, and symbol generators. @visx/curve 4.0.0 installed in 4.4 seconds, used 6 MB across 28 packages, bundled to 2.5 KB gzipped, and returned 0 audit findings in our sandbox.
When should you not use @visx/curve?
The application does not use visx. The source only re-exports @visx/vendor/d3-shape factories, so d3-shape is the clearer direct dependency.
Use it if
- Your chart already uses @visx/shape and needs a curve prop that follows the same visx dependency line.
- A custom chart must switch among linear, step, monotone, basis, cardinal, Catmull-Rom, or natural interpolation.
- Named imports and the sideEffects false declaration should let the bundler retain only the chosen curve implementation.
- The team wants D3's familiar curve factories without importing from @visx/vendor internals.
- The application does not use visx. The source only re-exports @visx/vendor/d3-shape factories, so d3-shape is the clearer direct dependency.
- You need a complete chart. This package provides interpolation functions and supplies no renderer, axes, scales, legends, labels, responsiveness, or tooltips.
- Animation must come with the chart API. The visx README says animation is intentionally left to separate React libraries.
- Smoothed paths must never imply values between samples. Basis, natural, cardinal, and Catmull-Rom curves can bend away from the straight segments; use linear or test the relevant monotone orientation.
- IE11 remains in the browser matrix. The visx 4 migration guide moves to modern browser targets and tells IE11 users to remain on visx 3.
Setup reality
We installed @visx/curve 4.0.0 in a fresh Node 22 Bookworm container. npm finished in 4.4 seconds, left 28 packages, and used 6 MB on disk. npm audit found 0 vulnerabilities at every severity. The package declares 1 direct dependency and 0 peers, is 44 KB unpacked, and includes TypeScript types. Our browser import measured 14.7 KB minified and 2.5 KB gzipped.
Version 4.0.0 is CommonJS with an exports map and a separate ESM entry. Both require() and import worked in our checks. Import from @visx/curve itself; the v4 migration guide makes package roots the supported surface and blocks old deep imports. @visx/vendor 4.0.0 supplies the D3 shape 3 factories. A normal React chart also needs @visx/shape plus whichever scale, axis, group, tooltip, or responsive packages it uses.
Curve choice changes the meaning readers infer from a path. curveMonotoneX assumes ordered x values, while curveMonotoneY assumes ordered y values. curveStepBefore and curveStepAfter assign the horizontal interval to opposite samples. Sort the data before rendering and decide how missing values split the line. Spline families can overshoot or hide sharp changes, so threshold and financial charts need visual checks against the raw points.
Parameterized factories return configured curves: cardinal accepts tension, Catmull-Rom accepts alpha, and bundle accepts beta. curveBundle implements lines rather than area boundaries. Open variants do not connect the outer control points; closed variants join the end back to the start. @visx/curve handles none of the surrounding work, including animation, keyboard interaction, accessible descriptions, clipping, scales, or responsive layout. React-based visx 4 packages require React 18 or 19.
Patterns
Keep straight segments between samples draw-linear-line
import { curveLinear } from '@visx/curve';
import { LinePath } from '@visx/shape';

<LinePath
  data={points}
  x={(point) => xScale(point.x)}
  y={(point) => yScale(point.y)}
  curve={curveLinear}
  stroke="currentColor"
/>
curveLinear connects each sample directly. It is the clearest baseline when smoothing could alter how readers judge the data.
Use monotone interpolation for time smooth-x-series
import { curveMonotoneX } from '@visx/curve';
import { LinePath } from '@visx/shape';

const ordered = [...points].sort((a, b) => a.timestamp - b.timestamp);
<LinePath
  data={ordered}
  x={(point) => xScale(point.timestamp)}
  y={(point) => yScale(point.value)}
  curve={curveMonotoneX}
/>
curveMonotoneX assumes x is ordered. Sort the 1-dimensional sequence before giving it to the path generator.
Use monotone interpolation for ranks smooth-y-series
import { curveMonotoneY } from '@visx/curve';

const ordered = [...points].sort((a, b) => a.rank - b.rank);
<LinePath
  data={ordered}
  x={(point) => xScale(point.value)}
  y={(point) => yScale(point.rank)}
  curve={curveMonotoneY}
/>
curveMonotoneY treats y as the ordered dimension. Ordinary left-to-right time series usually need curveMonotoneX.
Change a step after its timestamp hold-value-until-event
import { curveStepAfter } from '@visx/curve';

<LinePath
  data={events}
  x={(event) => xScale(event.at)}
  y={(event) => yScale(event.value)}
  curve={curveStepAfter}
/>
curveStepAfter holds the current y value until the path reaches the next x coordinate. This fits state that changes at recorded events.
Change a step before its timestamp apply-value-before-event
import { curveStepBefore } from '@visx/curve';

<LinePath
  data={events}
  x={(event) => xScale(event.at)}
  y={(event) => yScale(event.value)}
  curve={curveStepBefore}
/>
curveStepBefore assigns each interval differently from curveStepAfter. Pick the factory that matches when a new value takes effect.
Move each step at the midpoint center-step-change
import { curveStep } from '@visx/curve';

<LinePath
  data={points}
  x={(point) => xScale(point.x)}
  y={(point) => yScale(point.y)}
  curve={curveStep}
/>
curveStep places the vertical change halfway between adjacent x values. That midpoint may imply timing absent from the samples.
Render a natural cubic spline draw-natural-spline
import { curveNatural } from '@visx/curve';

<LinePath
  data={points}
  x={(point) => xScale(point.x)}
  y={(point) => yScale(point.y)}
  curve={curveNatural}
/>
curveNatural can bend beyond sampled values. Overlay points and check peaks before using it for thresholds or money.
Tighten a cardinal curve set-cardinal-tension
import { curveCardinal } from '@visx/curve';

const interpolation = curveCardinal.tension(0.4);
<LinePath
  data={points}
  x={(point) => xScale(point.x)}
  y={(point) => yScale(point.y)}
  curve={interpolation}
/>
curveCardinal.tension accepts values from 0 through 1. Higher tension pulls the result toward straight segments.
Choose Catmull-Rom parameterization set-catmull-rom-alpha
import { curveCatmullRom } from '@visx/curve';

const interpolation = curveCatmullRom.alpha(0.5);
<LinePath
  data={points}
  x={(point) => xScale(point.x)}
  y={(point) => yScale(point.y)}
  curve={interpolation}
/>
An alpha of 0.5 selects centripetal parameterization. Uneven point spacing still needs a visual check for loops and overshoot.
Join the last point to the first close-line-loop
import { curveLinearClosed } from '@visx/curve';

<LinePath
  data={outline}
  x={(point) => xScale(point.x)}
  y={(point) => yScale(point.y)}
  curve={curveLinearClosed}
/>
curveLinearClosed adds the closing segment itself. Duplicating the first point can create an unnecessary zero-length segment.
Treat outer points as spline controls use-open-basis
import { curveBasisOpen } from '@visx/curve';

<LinePath
  data={controlPoints}
  x={(point) => xScale(point.x)}
  y={(point) => yScale(point.y)}
  curve={curveBasisOpen}
/>
curveBasisOpen does not pass through the first and last control points. Small point sets may yield little or no visible path.
Adjust line bundling strength bundle-related-lines
import { curveBundle } from '@visx/curve';

const interpolation = curveBundle.beta(0.85);
<LinePath
  data={routePoints}
  x={(point) => xScale(point.x)}
  y={(point) => yScale(point.y)}
  curve={interpolation}
/>
curveBundle implements line output and lacks the startLine and endLine methods required for area boundaries.
Alternatives
| Package | Registry | Pick it when |
|---|---|---|
| d3-shape | npm | Use it directly outside visx or when the same module should also provide line, area, arc, pie, stack, and symbol generators. |
| @nivo/line | npm | Use it when a React line chart should arrive with axes, legends, tooltips, responsiveness, and animation. |
| recharts | npm | Use it when product code benefits from chart components more than low-level visualization composition. |
More web frontend guides
postcss · react · react-dom · tailwindcss · htmlparser2 · tailwind-merge · the whole shelf →
How this guide is made: grounded in the library's documentation, release notes, changelog, and issue history, on a fixed rubric — not a hands-on install of every release. The 50 most-downloaded entries are additionally install-verified in clean containers. Corrections: contact the desk.