reportlab review
ReportLab 5.0.1 generates PDF files directly from Python. Its `pdfgen` canvas draws text, paths, images, forms, links, and barcodes at explicit coordinates; Platypus lays `Paragraph`, `Table`, `Image`, and other flowables into frames across pages. Charts and graphics sit beside those two document APIs. The 5.0.1 patch changes `Canvas.getpdfdata` encoding, lets callers replace canvas construction in `renderPDF.drawToFile`, checks redirected resource hosts against the trusted-host settings, and fixes an indexing/setattr problem. Our Python 3.12 import worked in 0.03 seconds, but the distribution does not publish `py.typed`.
ReportLab 5.0.1 installed in 0.4 seconds, occupied 25 MB across 3 packages, imported in 0.03 seconds, and had zero pip-audit findings in our sandbox. Install it when Python must own PDF drawing or pagination; choose HTML/CSS tooling when document authors should work in web layout instead of points and flowables.
We installed it
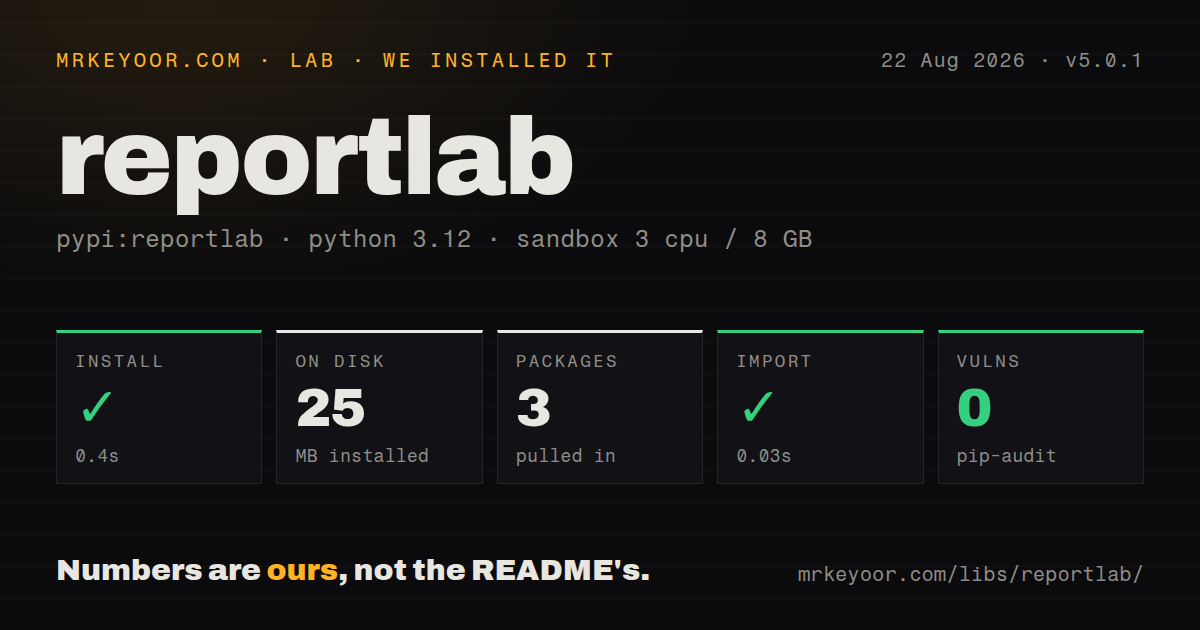
| Install | ✓ · 0.4s | 3 packages on disk · 25 MB |
| Import | ✓ | import reportlab in 0.03s · pure Python · requires Python >=3.9,<4 |
| Known vulns | 0 | (pip-audit) |
Answers from our run
Does reportlab install cleanly?
Yes. In a fresh container with an empty cache, pip install reportlab finished in 0.4s, leaving 3 packages and 25 MB on disk. pip-audit reported no known vulnerabilities.
What does reportlab need to run?
Python >=3.9,<4, and nothing compiled: it is pure Python. In our run import reportlab succeeded in 0.03s.
reportlab or weasyprint: which should you use?
weasyprint: Choose it when HTML and print CSS are the maintained document source and browser-like pagination is preferred. ReportLab 5.0.1 installed in 0.4 seconds, occupied 25 MB across 3 packages, imported in 0.03 seconds, and had zero pip-audit findings in our sandbox.
When should you not use reportlab?
The source is already HTML and CSS, and browser-style layout is the team's strongest skill. WeasyPrint is a closer model than Canvas coordinates or Platypus flowables.
Use it if
- Invoices, labels, certificates, tickets, or reports need exact PDF coordinates and repeatable server-side output.
- Python data should flow into multi-page paragraphs and tables without running a browser or office suite.
- The document needs built-in charts, vector drawings, barcodes, links, forms, or font embedding in the same process.
- The team can test rendered pages and owns the page-break rules for its real content and fonts.
- The source is already HTML and CSS, and browser-style layout is the team's strongest skill. WeasyPrint is a closer model than Canvas coordinates or Platypus flowables.
- Arbitrary user tables must always fit without layout tuning. Platypus asks flowables to wrap and split; wide columns and unbreakable cells can exceed the frame or raise layout errors.
- Static typing must cover the library boundary. Our installed 5.0.1 package had no `py.typed`, so type checkers cannot treat its inline annotations as a declared typed-package contract.
- Complex Arabic, Hebrew, or South Asian text must render correctly without a test matrix. The project calls this shaping and bidi support preliminary and exposes optional shaping dependencies.
- You mainly need to merge, split, rotate, inspect, or encrypt existing PDFs. pypdf targets those transformations, while ReportLab is centered on creating pages.
Setup reality
We installed reportlab 5.0.1 in a fresh Python 3.12 Bookworm sandbox. It completed in 0.4 seconds, left 3 packages using 25 MB, and imported in 0.03 seconds. pip-audit found zero known vulnerabilities. The package declares 7 direct dependencies when optional requirements are counted, requires Python 3.9 through 3.x, and is itself pure Python. It does not ship py.typed. PyPI identifies the license as BSD and points to license.txt for its full terms.
No account, daemon, or config file is needed. A canvas works in points with (0, 0) at the lower-left corner, then writes the PDF's final structures when save() runs. Platypus takes a list of flowables and asks each to wrap, split, and draw inside a frame. That is useful for pagination, but it does not make unknown content safe: long tokens, oversized images, tall headers, and wide tables need fixtures built from production data.
Fonts are an application asset. Register each TrueType face, ship the file, check its embedding terms, and test every script used by customers. Version 5.0.1 offers optional bidi and shaping extras, while the change history still labels South Asian shaping and right-to-left work preliminary. Built-in PDF fonts cover a narrower character set. Image decoding also expands memory before the page is compressed, so constrain pixel dimensions before building large reports.
Some helpers can open image or document resources by URL. The 5.0.1 redirect fix applies trustedHosts and trustedSchemes to the destination host as well, yet a public report endpoint still needs its own URL allowlist, response limits, and timeouts. Generation consumes CPU and memory in the request process. Queue large batches, cap rows and images, and create a fresh canvas or story per job instead of sharing mutable document objects across concurrent requests.
Patterns
Draw text at fixed coordinates draw-single-page
from reportlab.lib.pagesizes import A4
from reportlab.pdfgen import canvas

c = canvas.Canvas('invoice.pdf', pagesize=A4)
c.setFont('Helvetica', 12)
c.drawString(72, 760, 'Invoice 42')
c.save()
Canvas units are points and the default origin is the lower-left corner. `save()` writes the final PDF structures.
Generate a PDF in memory return-pdf-bytes
from io import BytesIO
from reportlab.pdfgen import canvas

buffer = BytesIO()
c = canvas.Canvas(buffer)
c.drawString(72, 720, 'Receipt')
c.save()
pdf_bytes = buffer.getvalue()
Read the buffer only after `save()` completes. The method finalizes cross-references and trailers required by PDF readers.
Lay out a multi-page story build-flowable-document
from reportlab.lib.pagesizes import A4
from reportlab.lib.styles import getSampleStyleSheet
from reportlab.platypus import Paragraph, SimpleDocTemplate, Spacer

styles = getSampleStyleSheet()
story = [
    Paragraph('Monthly report', styles['Title']),
    Spacer(1, 12),
    Paragraph(body, styles['BodyText']),
]
SimpleDocTemplate('report.pdf', pagesize=A4).build(story)
Platypus wraps each flowable against the current frame and may move or split it when the remaining height is insufficient.
Repeat headings across table pages repeat-table-header
from reportlab.platypus import Table

data = [['Item', 'Quantity', 'Price'], *rows]
table = Table(data, colWidths=[260, 80, 80], repeatRows=1)
`repeatRows=1` repeats the first row after a page split. Column widths still need to fit the document frame.
Apply borders and alignment style-table
from reportlab.lib import colors
from reportlab.platypus import TableStyle

table.setStyle(TableStyle([
    ('BACKGROUND', (0, 0), (-1, 0), colors.HexColor('#eeeeee')),
    ('GRID', (0, 0), (-1, -1), 0.5, colors.grey),
    ('ALIGN', (1, 1), (-1, -1), 'RIGHT'),
    ('VALIGN', (0, 0), (-1, -1), 'TOP'),
]))
A style changes drawing and cell layout; it does not truncate an oversized value or find an optimal width for unknown content.
Draw a footer on every page add-page-footer
def draw_footer(canvas, doc):
    canvas.saveState()
    canvas.setFont('Helvetica', 9)
    canvas.drawRightString(doc.pagesize[0] - 36, 24, f'Page {doc.page}')
    canvas.restoreState()

doc.build(story, onFirstPage=draw_footer, onLaterPages=draw_footer)
Saving and restoring canvas state prevents the footer's font, color, or transforms from affecting the story content.
Register an application font embed-true-type-font
from reportlab.pdfbase import pdfmetrics
from reportlab.pdfbase.ttfonts import TTFont

pdfmetrics.registerFont(TTFont('AppSans', 'fonts/AppSans-Regular.ttf'))
c.setFont('AppSans', 11)
Registration uses a process-global name. Ship the font file, verify its embedding license, and test the glyphs your documents require.
Fit an image without stretching it scale-image
from reportlab.lib.utils import ImageReader
from reportlab.platypus import Image

source = ImageReader('chart.png')
width, height = source.getSize()
max_width = 420
image = Image('chart.png', width=max_width, height=height * max_width / width)
ReportLab decodes the source image. Validate dimensions before construction so a compressed upload cannot expand beyond the worker's memory budget.
Start an appendix on a new page force-page-break
from reportlab.platypus import PageBreak, Paragraph

story.extend([
    PageBreak(),
    Paragraph('Appendix', styles['Heading1']),
])
Add `PageBreak` at the top story level. A break nested in another flowable does not necessarily act as a document-level page boundary.
Link to a named destination add-internal-link
c.bookmarkPage('terms')
c.drawString(72, 720, 'Terms')

c.linkAbsolute(
    'Jump to terms',
    'terms',
    Rect=(72, 680, 180, 700),
)
The link rectangle uses default page coordinates. The destination name must be created in the same document.
Place a Code 128 barcode draw-code128-barcode
from reportlab.graphics.barcode import code128

barcode = code128.Code128('ORDER-00042', barHeight=36, barWidth=0.8)
barcode.drawOn(c, 72, 640)
Render and scan a physical sample at the intended printer resolution; valid barcode data can still be too dense for the scanner.
Require a password to open the PDF encrypt-pdf
from reportlab.lib.pdfencrypt import StandardEncryption
from reportlab.pdfgen import canvas

encryption = StandardEncryption(
    userPassword,
    ownerPassword=ownerPassword,
    canPrint=0,
)
c = canvas.Canvas('private.pdf', encrypt=encryption)
c.drawString(72, 720, 'Private report')
c.save()
PDF permissions depend on reader enforcement. Password encryption does not replace authorization, secure delivery, or server-side access controls.
Alternatives
| Package | Registry | Pick it when |
|---|---|---|
| weasyprint | PyPI | Choose it when HTML and print CSS are the maintained document source and browser-like pagination is preferred. |
| fpdf2 | PyPI | Choose it for a smaller imperative API covering ordinary text, images, tables, and page construction. |
| pypdf | PyPI | Choose it to read, combine, crop, rotate, encrypt, or otherwise transform PDFs that already exist. |
More utils guides
lru-cache · ajv · type-fest · p-limit · find-up · js-yaml · the whole shelf →
How this guide is made: grounded in the library's documentation, release notes, changelog, and issue history, on a fixed rubric — not a hands-on install of every release. The 50 most-downloaded entries are additionally install-verified in clean containers. Corrections: contact the desk.