pydot review
pydot 4.0.1 is a Python object model and parser for Graphviz's DOT graph language. It can build nodes, edges, subgraphs, and attributes; parse one or more graphs from DOT text; emit raw DOT itself; or call a Graphviz program to lay out and render PNG, SVG, PDF, and other formats. The current patch raises pyparsing to 3.1 or newer and fixes parsing of `strict`, backslash-continued quoted identifiers, and plus-concatenated strings. Version 4 also introduces official type annotations and complex edges with subgraph endpoints. Graph algorithms are outside its scope; NetworkX handles those and converts to or from pydot.
pydot 4.0.1 installed in 0.2 seconds, used 1 MB, imported in 0.33 seconds, and had 0 audit findings in our sandbox, but rendered output still requires a separate Graphviz installation. It is the practical bridge for Python code that must parse and edit DOT; choose NetworkX for analysis and isolate any untrusted rendering workload.
We installed it
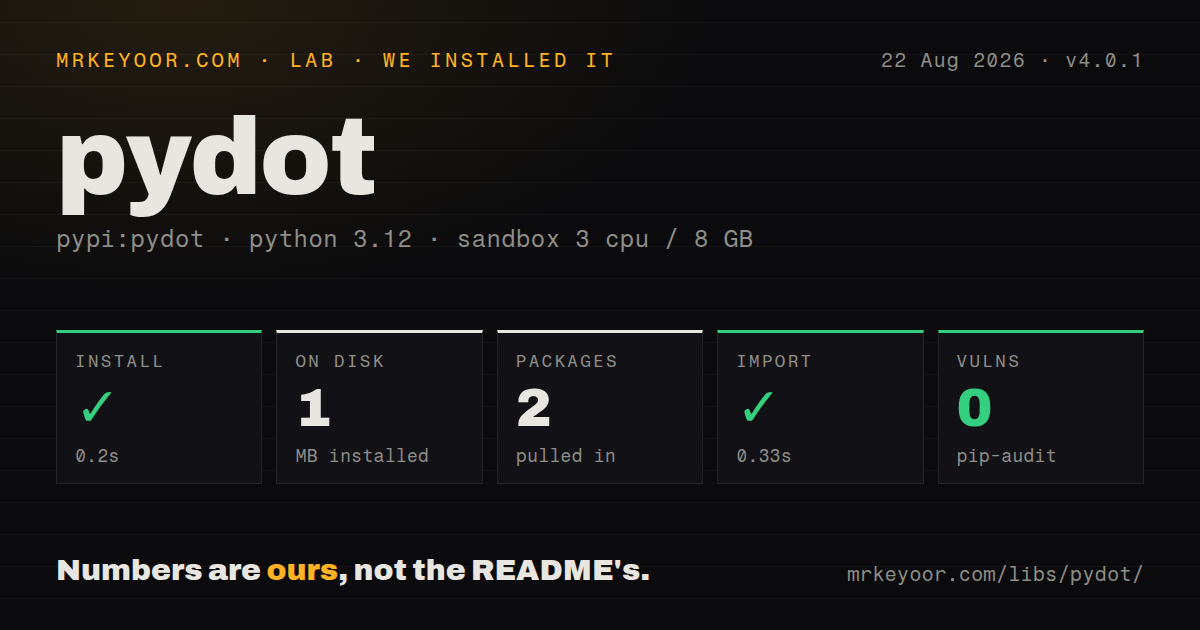
| Install | ✓ · 0.2s | 2 packages on disk · 1 MB |
| Import | ✓ | import pydot in 0.33s · pure Python · py.typed · requires Python >=3.8 |
| Known vulns | 0 | (pip-audit) |
Answers from our run
Does pydot install cleanly?
Yes. In a fresh container with an empty cache, pip install pydot finished in 0.2s, leaving 2 packages and 1 MB on disk. pip-audit reported no known vulnerabilities.
What does pydot need to run?
Python >=3.8, and nothing compiled: it is pure Python. In our run import pydot succeeded in 0.33s, and the package ships py.typed for type checkers.
pydot or graphviz: which should you use?
graphviz: Use the Python graphviz package when the job is mainly constructing DOT and invoking Graphviz, with no need for pydot's parser and NetworkX bridge. pydot 4.0.1 installed in 0.2 seconds, used 1 MB, imported in 0.33 seconds, and had 0 audit findings in our sandbox, but rendered output still requires a separate Graphviz installation.
When should you not use pydot?
You expect pip install pydot to install a renderer. The README requires Graphviz as a separate system package for every create_*, write_png, write_svg, and other rendered output call.
Use it if
- Python code needs to read, edit, or generate DOT while preserving Graphviz-specific graph, node, and edge attributes.
- A service can install Graphviz separately and wants SVG, PNG, PDF, or layout-processed DOT as bytes or files.
- NetworkX owns graph analysis while pydot supplies DOT interchange and Graphviz rendering.
- Existing DOT may contain several top-level graphs, strict declarations, clusters, ports, HTML labels, or subgraph edge endpoints.
- You expect `pip install pydot` to install a renderer. The README requires Graphviz as a separate system package for every `create_*`, `write_png`, `write_svg`, and other rendered output call.
- The task is shortest paths, connected components, centrality, graph mutation algorithms, or a general network data model. pydot models DOT syntax; NetworkX owns those operations.
- Untrusted users can submit arbitrary, very large DOT directly to a public render endpoint. Parsing and the external Graphviz layout process need input limits, timeouts, filesystem isolation, and output caps supplied by your service.
- Static typing must eliminate unknown values across the full API. Version 4 adds initial annotations, but the changelog says many `Any` types remain.
- You need a pure-Python deployment that cannot add operating-system packages. Raw DOT parsing and emission work, while actual layout and image generation depend on Graphviz executables.
Setup reality
We installed pydot 4.0.1 in a fresh Python 3.12 Bookworm sandbox. The install took 0.2 seconds, left 2 packages, and occupied 1 MB on disk. Our package inspection counted 13 direct dependencies. It is pure Python, requires Python 3.8 or newer, and includes a py.typed marker. pip-audit reported 0 known vulnerabilities. import pydot worked in 0.33 seconds.
The Python install does not provide Graphviz. Add dot through the operating system or container image and ensure the executable is on PATH; alternatively pass a particular program name or path through the prog argument where supported. Parsing DOT and calling to_string() or write_raw() do not need that executable. Rendering methods start a subprocess and return Graphviz errors when the binary is absent or rejects the graph.
Both graph_from_dot_data() and graph_from_dot_file() return a list because one DOT input can contain multiple graphs. Select a graph deliberately instead of assuming index 0 exists. pydot preserves raw names internally and quotes them on output; attribute values are DOT strings, so labels, ports, HTML-like values, and Graphviz keywords still require attention to DOT syntax. Version 4.0.1 specifically repairs several quoted-string and strict-graph parser cases.
Graphviz layout can consume substantial CPU and memory on large or adversarial graphs. Run public rendering with process timeouts and file limits outside the request process. pydot's DEBUG logs may contain complete DOT text and graph data, according to its README, so leave that logging off around secrets. Use write_raw() when another system only needs DOT; every rendered format adds an external process and its platform-specific fonts and layout behavior.
Patterns
Create a directed graph from Python objects build-directed-graph
import pydot

graph = pydot.Dot('pipeline', graph_type='digraph', rankdir='LR')
graph.add_node(pydot.Node('fetch', shape='box'))
graph.add_node(pydot.Node('store', shape='box'))
graph.add_edge(pydot.Edge('fetch', 'store', label='records'))
Use `graph_type='digraph'` for directed edges. Attribute values are emitted as DOT and interpreted by Graphviz during layout.
Parse every graph in a DOT string parse-dot-string
graphs = pydot.graph_from_dot_data('digraph one { a -> b }')
if not graphs:
    raise ValueError('no graph found')
graph = graphs[0]
The parser always returns a list because one input can contain more than one top-level graph.
Read DOT from a file with an explicit encoding parse-dot-file
graphs = pydot.graph_from_dot_file('architecture.dot', encoding='utf-8')
graph = graphs[0]
File parsing needs pyparsing but does not need the Graphviz executable. Check the returned list before indexing untrusted input.
Generate DOT without launching Graphviz emit-raw-dot
dot_text = graph.to_string()
graph.write_raw('pipeline.dot')
Raw output is produced by pydot itself. It has no computed positions because no Graphviz layout program ran.
Render a PNG through Graphviz render-png
graph.write_png('pipeline.png', prog='dot')The `dot` executable must be installed and reachable. This call starts an external process and can raise when Graphviz rejects the DOT.
Return SVG bytes for a response or notebook create-svg-bytes
svg_bytes = graph.create_svg(prog='dot')`create_svg()` returns bytes from Graphviz. Treat generated SVG from untrusted labels as active content unless it is sanitized or served safely.
Select a Graphviz layout program choose-layout-engine
graph.write_svg('network.svg', prog='neato')`dot` targets hierarchical graphs; `neato` uses a spring model. Results depend on the installed Graphviz version and fonts.
Find a node and change its attributes edit-node-attributes
matches = graph.get_node('store')
if matches:
    matches[0].set_shape('cylinder')
    matches[0].set_fillcolor('lightgray')
    matches[0].set_style('filled')
`get_node()` returns a list. Duplicate node statements can produce more than one matching object.
Group nodes in a Graphviz cluster add-cluster
cluster = pydot.Cluster('workers', label='Workers', color='gray')
cluster.add_node(pydot.Node('parse'))
cluster.add_node(pydot.Node('index'))
graph.add_subgraph(cluster)
Cluster naming and layout are Graphviz conventions. Rendering requires Graphviz even though creating the subgraph object does not.
Pass an HTML-like label to Graphviz use-html-label
node = pydot.Node(
    'job',
    label='<<TABLE BORDER="0"><TR><TD>Job</TD></TR></TABLE>>',
    shape='plain',
)
graph.add_node(node)
HTML-like labels follow Graphviz's label grammar, not browser HTML. Keep the outer angle brackets and escape data inserted into the DOT source.
Render a NetworkX graph through pydot convert-networkx
import networkx as nx

nx_graph = nx.DiGraph([('fetch', 'parse'), ('parse', 'store')])
dot_graph = nx.drawing.nx_pydot.to_pydot(nx_graph)
dot_graph.write_svg('pipeline.svg')
NetworkX owns algorithms and graph data here. pydot is the conversion and Graphviz-rendering layer.
Report a failed external render capture-graphviz-error
import pydot

try:
    png = graph.create_png()
except (OSError, pydot.PydotException) as error:
    raise RuntimeError('Graphviz render failed') from error
Missing executables can raise an OS error; invalid input or a failed Graphviz command uses pydot's exception hierarchy. Add a process-level timeout outside this API for hostile workloads.
Alternatives
| Package | Registry | Pick it when |
|---|---|---|
| graphviz | PyPI | Use the Python graphviz package when the job is mainly constructing DOT and invoking Graphviz, with no need for pydot's parser and NetworkX bridge. |
| pygraphviz | PyPI | Use it when direct Graphviz library bindings and tighter graph integration justify compiling or installing native extension dependencies. |
| networkx | PyPI | Use it when graph algorithms and analysis are primary; convert to pydot only at the DOT or rendering boundary. |
| graphviz2drawio | PyPI | Use it when DOT graphs must become editable draw.io or Lucid diagrams rather than fixed Graphviz output. |
More data guides
numpy · fsspec · pandas · sqlalchemy · pyarrow · lxml · the whole shelf →
How this guide is made: grounded in the library's documentation, release notes, changelog, and issue history, on a fixed rubric — not a hands-on install of every release. The 50 most-downloaded entries are additionally install-verified in clean containers. Corrections: contact the desk.