graphviz review
We installed Python `graphviz` 0.21 and confirmed that it is a small DOT source builder plus a subprocess interface to the separate Graphviz executables. `Graph` and `Digraph` collect nodes, edges, attributes, and subgraphs as text; `render()` and `pipe()` then ask an engine such as `dot` or `neato` to produce SVG, PDF, or PNG. Version 0.21 drops Python 3.8, tags Python 3.13 support, adds `svg_inline` output for headerless HTML embedding when Graphviz 10.0.1 or newer is installed, and moves packaging to `pyproject.toml` with a tar.gz source distribution.
Python graphviz 0.21 installed in 0.2 seconds as one 1 MB package and imported in 0.23 seconds in our sandbox, but rendering still needs a separate Graphviz executable. Install it for DOT generation and static rendering; choose NetworkX for analysis or pydot when existing DOT must be parsed and changed.
We installed it
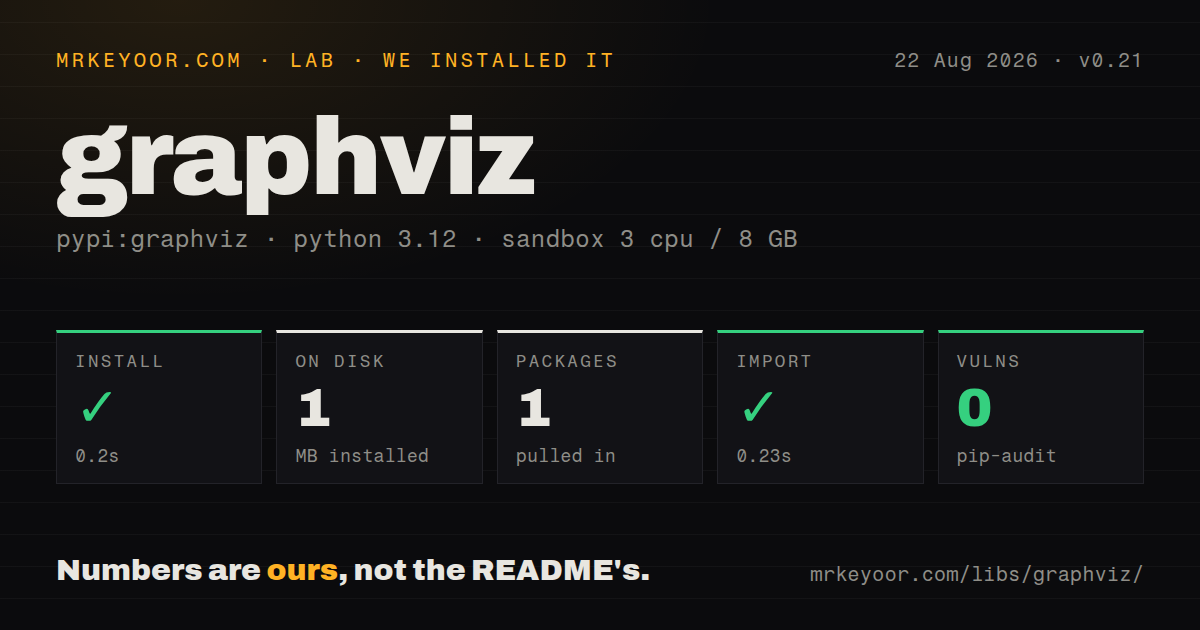
| Install | ✓ · 0.2s | 1 package on disk · 1 MB |
| Import | ✓ | import graphviz in 0.23s · pure Python · requires Python >=3.9 |
| Known vulns | 0 | (pip-audit) |
Answers from our run
Does graphviz install cleanly?
Yes. In a fresh container with an empty cache, pip install graphviz finished in 0.2s, leaving 1 package and 1 MB on disk. pip-audit reported no known vulnerabilities.
What does graphviz need to run?
Python >=3.9, and nothing compiled: it is pure Python. In our run import graphviz succeeded in 0.23s.
graphviz or pydot: which should you use?
pydot: Choose it when existing DOT must be parsed and edited as Python objects. Python graphviz 0.21 installed in 0.2 seconds as one 1 MB package and imported in 0.23 seconds in our sandbox, but rendering still needs a separate Graphviz executable.
When should you not use graphviz?
The runtime cannot install system packages: the Python wheel does not contain dot, so rendering fails with ExecutableNotFound when Graphviz is absent from PATH
Use it if
- You want Python code to generate a static dependency graph, state machine, tree, or workflow while Graphviz chooses node positions
- Another library already emits DOT and you need to render that source to SVG, PDF, or PNG
- A notebook should display a generated diagram inline through its normal rich-display hook
- The DOT source should remain a plain-text artifact that can be reviewed or committed
- The runtime cannot install system packages: the Python wheel does not contain `dot`, so rendering fails with `ExecutableNotFound` when Graphviz is absent from PATH
- You need graph algorithms or mutable graph data: this wrapper does not provide traversal, shortest paths, centrality, or cycle detection
- Existing DOT must be parsed into editable nodes and edges: `Source` keeps input as text rather than building a Python object model from it
- The output must be interactive or manually positioned: Graphviz creates a static layout, and this package exposes the engine's result rather than a browser interaction layer
- User strings can be copied into labels without review: angle brackets and backslash sequences have DOT meaning, and the README sends readers to its escaping guide
- You need one install with a single dependency policy: PyPI and the Graphviz operating-system package are released, patched, and licensed through separate channels
Setup reality
Our clean install of graphviz==0.21 finished in 0.2 seconds. It left 1 Python package using 1 MB, and pip-audit found 0 known vulnerabilities. The measured package metadata reports 14 direct dependencies, Python 3.9 or newer, pure Python code, no py.typed marker, and an unknown license. import graphviz worked in 0.23 seconds. Those checks prove the wrapper imports; they do not prove that a diagram can render.
Rendering needs a second installation from the Graphviz project. On Debian that is commonly the graphviz system package; macOS and Windows use their own package or installer. The directory containing dot must appear on PATH for the Python process, including inside a container, notebook kernel, worker, or service account. Conda users can install python-graphviz from conda-forge, which pulls the matching Graphviz package, while pip install graphviz does not.
Every render() or pipe() call launches an external program. Missing executables raise ExecutableNotFound; invalid DOT and engine failures surface as CalledProcessError with Graphviz stderr. Use pipe() for in-memory bytes in a web request and render(cleanup=True) when a source file on disk is temporary. view=True opens a desktop application, which is inappropriate on headless servers and can surprise a local script by launching a viewer.
DOT quoting is the first data trap. Backslashes, angle-bracket HTML labels, record ports, and cluster names all change parsing or layout. Call graphviz.escape() for arbitrary label text and use nohtml() when leading angle brackets must stay literal. Version 0.21's svg_inline format also depends on Graphviz 10.0.1 or newer, so an older system binary can reject a format that the Python wrapper accepts. Different engines honor different attributes; for example, rankdir is intended for layered dot layouts rather than every engine.
Patterns
Create a directed graph and inspect DOT build-directed-graph
import graphviz

dot = graphviz.Digraph('deploy')
dot.node('build', 'Build image')
dot.node('test', 'Run tests')
dot.edge('build', 'test')

print(dot.source)
Building and printing source does not call an external executable. This is the part you can unit test on a machine without Graphviz installed.
Render an SVG file and remove the DOT file render-svg
dot = graphviz.Digraph(format='svg')
dot.edge('a', 'b')
output_path = dot.render('build/dependency-map', cleanup=True)
print(output_path)
render() needs `dot` on PATH. cleanup=True deletes the intermediate source file after a successful render and leaves the requested image.
Return rendered bytes without writing a file pipe-image-bytes
diagram = graphviz.Digraph()
diagram.edge('queued', 'running')

png = diagram.pipe(format='png')
svg = diagram.pipe(format='svg', encoding='utf-8')
Without encoding, pipe() returns bytes. Supplying an encoding returns text and makes sense for textual formats such as SVG or DOT.
Produce SVG ready for an HTML fragment inline-svg
diagram = graphviz.Digraph(format='svg_inline')
diagram.edge('input', 'output')
fragment = diagram.pipe(encoding='utf-8')
svg_inline arrived in Python package 0.21 and requires the separately installed Graphviz executable to be version 10.0.1 or newer.
Use a spring layout for an undirected graph select-layout-engine
mesh = graphviz.Graph(engine='neato')
mesh.edges([('a', 'b'), ('b', 'c'), ('c', 'a')])
mesh.render('build/mesh', format='svg', cleanup=True)
Graph writes undirected edges while Digraph writes arrows. Engine choice changes layout behavior, and an attribute supported by `dot` may have no effect in `neato`.
Set graph, node, and edge defaults set-default-attributes
dot = graphviz.Digraph(
    graph_attr={'rankdir': 'LR'},
    node_attr={'shape': 'box', 'style': 'rounded'},
    edge_attr={'color': '#666666'},
)
dot.edge('api', 'database', label='writes')
Defaults apply to elements created under that scope. An explicit attribute on a node or edge overrides the current default.
Group related nodes in a cluster create-cluster
dot = graphviz.Digraph()
with dot.subgraph(name='cluster_workers') as workers:
    workers.attr(label='Workers')
    workers.node('email')
    workers.node('billing')
dot.node('queue')
dot.edges([('queue', 'email'), ('queue', 'billing')])
Graphviz recognizes a boxed cluster only when the subgraph name begins with `cluster`. A normal subgraph still scopes attributes but gets no cluster boundary.
Keep arbitrary text from becoming DOT syntax escape-user-label
raw_label = r'<draft> path\name'
dot = graphviz.Digraph()
dot.node('input', graphviz.escape(raw_label))
dot.node('literal-tag', graphviz.nohtml('<config>'))
DOT treats backslash sequences and angle-bracket labels specially. escape() protects backslashes; nohtml() keeps a leading angle-bracket string from being parsed as an HTML label.
Render DOT text produced by another tool render-existing-source
source = graphviz.Source(dot_text)
source.render('build/model-tree', format='pdf', cleanup=True)

from_file = graphviz.Source.from_file('architecture.gv')
Source wraps text for saving or rendering. It does not parse that text into nodes you can remove or edit; use pydot for structural changes.
Distinguish a missing executable from invalid DOT handle-render-errors
try:
    diagram.pipe(format='svg')
except graphviz.ExecutableNotFound as exc:
    raise RuntimeError('Install Graphviz and put dot on PATH') from exc
except graphviz.CalledProcessError as exc:
    logger.error('Graphviz failed: %s', exc.stderr)
    raise
ExecutableNotFound means the system command could not start. CalledProcessError means it ran and returned a failure, often with a useful DOT parser message on stderr.
Show a diagram in a Jupyter cell display-in-notebook
import graphviz

graphviz.set_jupyter_format('svg')
diagram = graphviz.Digraph()
diagram.edge('raw', 'clean')
diagram
The object must be the cell's displayed value. The notebook kernel still needs access to a working Graphviz executable for the rich representation to render.
Rearrange a shallow graph with unflatten narrow-wide-graph
wide = graphviz.Digraph()
for index in range(12):
    wide.edge('root', f'leaf-{index}')

narrow = wide.unflatten(stagger=3)
narrow.render('build/narrow', format='png')
unflatten launches the separate Graphviz `unflatten` command and returns a new Source. Installing only a `dot` binary is insufficient if that companion executable is missing.
Alternatives
| Package | Registry | Pick it when |
|---|---|---|
| pydot | PyPI | Choose it when existing DOT must be parsed and edited as Python objects. |
| pygraphviz | PyPI | Choose it for direct bindings to the Graphviz C library and access to laid-out graph attributes, accepting a compiled extension. |
| networkx | PyPI | Choose it when analysis and traversal are the main job and drawing is secondary. |
More data guides
numpy · fsspec · pandas · sqlalchemy · pyarrow · lxml · the whole shelf →
How this guide is made: grounded in the library's documentation, release notes, changelog, and issue history, on a fixed rubric — not a hands-on install of every release. The 50 most-downloaded entries are additionally install-verified in clean containers. Corrections: contact the desk.