@opentelemetry/api review
@opentelemetry/api 1.9.1 is the contract shared by JavaScript instrumentation and whichever OpenTelemetry SDK an application selects. A library can create tracers, meters, context, baggage, propagation calls, and diagnostic messages without taking a dependency on one exporter or observability vendor. Every call falls back to a no-op until the application registers providers. Stable interfaces live in the main API, while experimental signals use separate packages and version tracks. Our install confirmed bundled types and both require() and ESM import.
@opentelemetry/api 1.9.1 installed in 0.5 seconds with 0 dependencies and measured 4.6 KB gzipped in our browser build, but it exports no telemetry until an SDK registers providers. Libraries should depend on this API; applications must add and initialize the actual telemetry pipeline.
We installed it
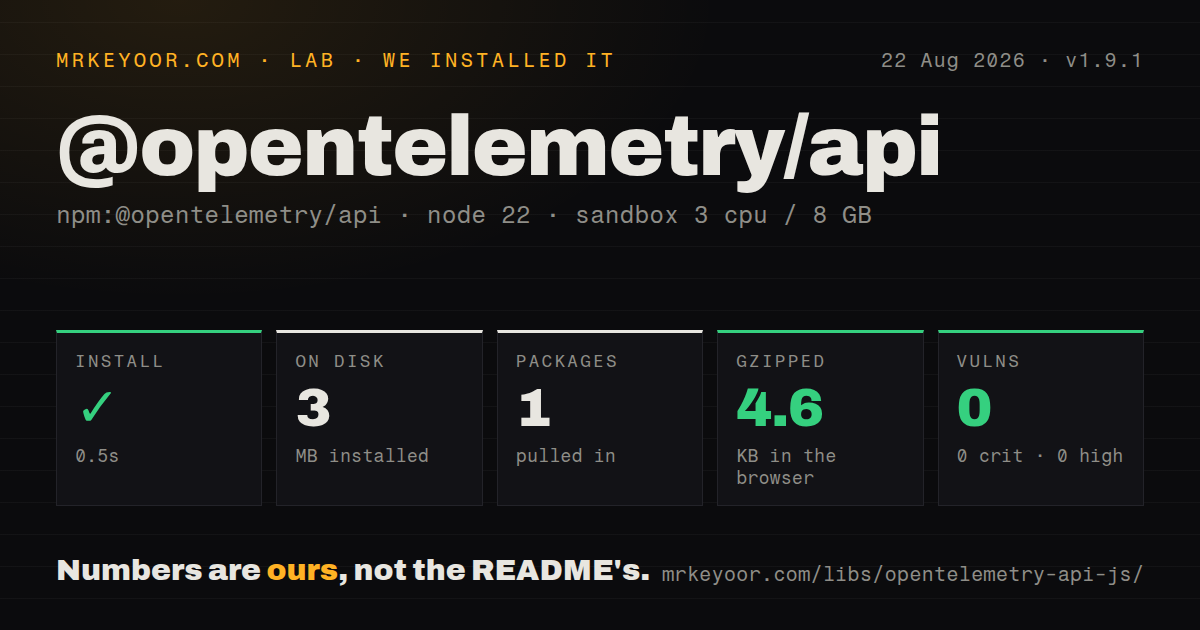
| Install | ✓ · 0.5s | 1 package on disk · 3 MB |
| Import | ✓ | ESM import works · require() works · CommonJS package with exports map |
| Browser | 4.6 KB | gzipped (13.2 KB minified), bundled with esbuild |
| Types | ✓ | TypeScript types bundled |
| Known vulns | 0 | 0 critical · 0 high · 0 moderate · 0 low (npm audit) |
Answers from our run
Does @opentelemetry/api install cleanly?
Yes. In a fresh container with an empty cache, npm install @opentelemetry/api finished in 0.5s, leaving 1 package and 3 MB on disk. npm audit reported no known vulnerabilities.
How much does @opentelemetry/api add to a browser bundle?
4.6 KB gzipped (13.2 KB minified) when the whole package is bundled for the browser with esbuild. Importing only part of it is usually smaller.
Does @opentelemetry/api work with both ESM and CommonJS?
Yes. Both import '@opentelemetry/api' and require('@opentelemetry/api') worked in Node 22 in our run. The package is published as CommonJS with an exports map.
Does @opentelemetry/api include TypeScript types?
Yes, type declarations ship inside the package, so no @types install is needed.
@opentelemetry/api or @opentelemetry/sdk-node: which should you use?
@opentelemetry/sdk-node: Use it in a Node application that must register providers, processors, resources, and exporters. @opentelemetry/api 1.9.1 installed in 0.5 seconds with 0 dependencies and measured 4.6 KB gzipped in our browser build, but it exports no telemetry until an SDK registers providers.
When should you not use @opentelemetry/api?
You expect this package alone to send data; no-op defaults require an SDK, processors, and exporters at the application boundary
Use it if
- A reusable library should emit telemetry without forcing its consumers onto one SDK or backend
- An application needs manual spans, metrics, propagation, or baggage beside an installed SDK
- Instrumentation code must load in Node and current ES2022 browsers
- Telemetry should remain optional and safe when the host registers no provider
- You expect this package alone to send data; no-op defaults require an SDK, processors, and exporters at the application boundary
- A vendor-specific agent with automatic setup is the actual requirement; dd-trace can involve less assembly for Datadog-only deployments
- Target browsers lack ES2022 and the build will not transpile or polyfill; the project names ES2022 as its browser floor
- A reusable package intends to call SDK internals; the project tells library authors to depend only on the public API
- Stable and experimental package versions will be mixed casually; the monorepo publishes a compatibility matrix because their numbers differ
Setup reality
We installed @opentelemetry/api 1.9.1 in a fresh Node 22 sandbox in 0.5 seconds. The result was 1 package and 3 MB on disk, with 0 known vulnerabilities from npm audit. The package declares 0 direct dependencies and 0 peer dependencies and is 2,836 KB unpacked under Apache-2.0. Its declared Node floor is 8. Bundled TypeScript declarations were present.
The package is CommonJS with an exports map, and both require() and ESM import worked in our check. A complete esbuild browser import measured 13.2 KB minified and 4.6 KB gzipped. The repository currently supports active and maintenance Node LTS releases rather than promising tests on every version allowed by the old engines floor. Browser instrumentation is experimental and assumes ES2022 features.
No collector URL, credential, or exporter belongs in this package. The application must install an SDK, choose resources and exporters, and register providers before instrumented modules do useful work. Run the telemetry bootstrap before application imports, often through Node preload, because an early module can obtain no-op behavior. Each signal should have one process-wide provider owner.
Active parentage depends on the SDK's context manager. Starting a span does not make it active for nested asynchronous work, so wrap the work with context.with or an SDK helper and end the span in finally. Keep metric attributes bounded; user IDs and raw URLs create high-cardinality series. Diagnostic logging is global and should be configured once in the bootstrap. Baggage may cross service boundaries, so never place secrets in it.
Patterns
Start and end one manual span create-span
import { trace } from '@opentelemetry/api';
const tracer = trace.getTracer('checkout','1.0.0');
const span = tracer.startSpan('price-order');
try { await priceOrder(); } finally { span.end(); }
With no registered tracing SDK this does nothing, and startSpan alone does not activate the span.
Run asynchronous work under a span activate-span
import { context, trace } from '@opentelemetry/api';
const span = tracer.startSpan('checkout');
await context.with(trace.setSpan(context.active(), span), submitOrder);
span.end();
The SDK must install a context manager or asynchronous parentage will not propagate.
Attach failure details to a span record-exception
import { SpanStatusCode } from '@opentelemetry/api';
try { await task(); } catch (error) { span.recordException(error); span.setStatus({ code: SpanStatusCode.ERROR, message: error.message }); throw error; }
recordException neither rethrows the error nor closes the span, so the caller must do both.
Increment a bounded metric count-operations
import { metrics } from '@opentelemetry/api';
const completed = metrics.getMeter('worker').createCounter('jobs.completed');
completed.add(1, { queue: 'email' });
Use bounded attributes such as queue names; IDs and unnormalized URLs create excessive series cardinality.
Write propagation headers inject-context
import { context, propagation } from '@opentelemetry/api';
const headers = {};
propagation.inject(context.active(), headers);
The registered propagator chooses the header format; the no-op default writes nothing.
Continue an incoming trace context extract-context
const parent = propagation.extract(context.active(), request.headers);
await context.with(parent, () => handleRequest(request));
extract parses the carrier, but context.with is what makes the result active during handling.
Carry a non-secret tenant value attach-baggage
const bag = propagation.createBaggage({ tenant: { value: tenant } });
const ctx = propagation.setBaggage(context.active(), bag);
await context.with(ctx, work);
Baggage can leave the process through propagators, so exclude credentials and sensitive user data.
Turn on API diagnostics once enable-diagnostics
import { diag, DiagConsoleLogger, DiagLogLevel } from '@opentelemetry/api';
diag.setLogger(new DiagConsoleLogger(), DiagLogLevel.DEBUG);
The diagnostic logger is global and DEBUG can be noisy; configure it in telemetry startup code.
Alternatives
| Package | Registry | Pick it when |
|---|---|---|
| @opentelemetry/sdk-node | npm | Use it in a Node application that must register providers, processors, resources, and exporters |
| @opentelemetry/sdk-trace-base | npm | Use it for direct tracing SDK control shared by Node and browser code |
| dd-trace | npm | Use it for a Datadog-specific agent with automatic instrumentation |
More infra guides
boto3 · opentelemetry-api · psutil · distro · @aws-sdk/client-s3 · google-cloud-storage · the whole shelf →
How this guide is made: grounded in the library's documentation, release notes, changelog, and issue history, on a fixed rubric — not a hands-on install of every release. The 50 most-downloaded entries are additionally install-verified in clean containers. Corrections: contact the desk.