psutil review
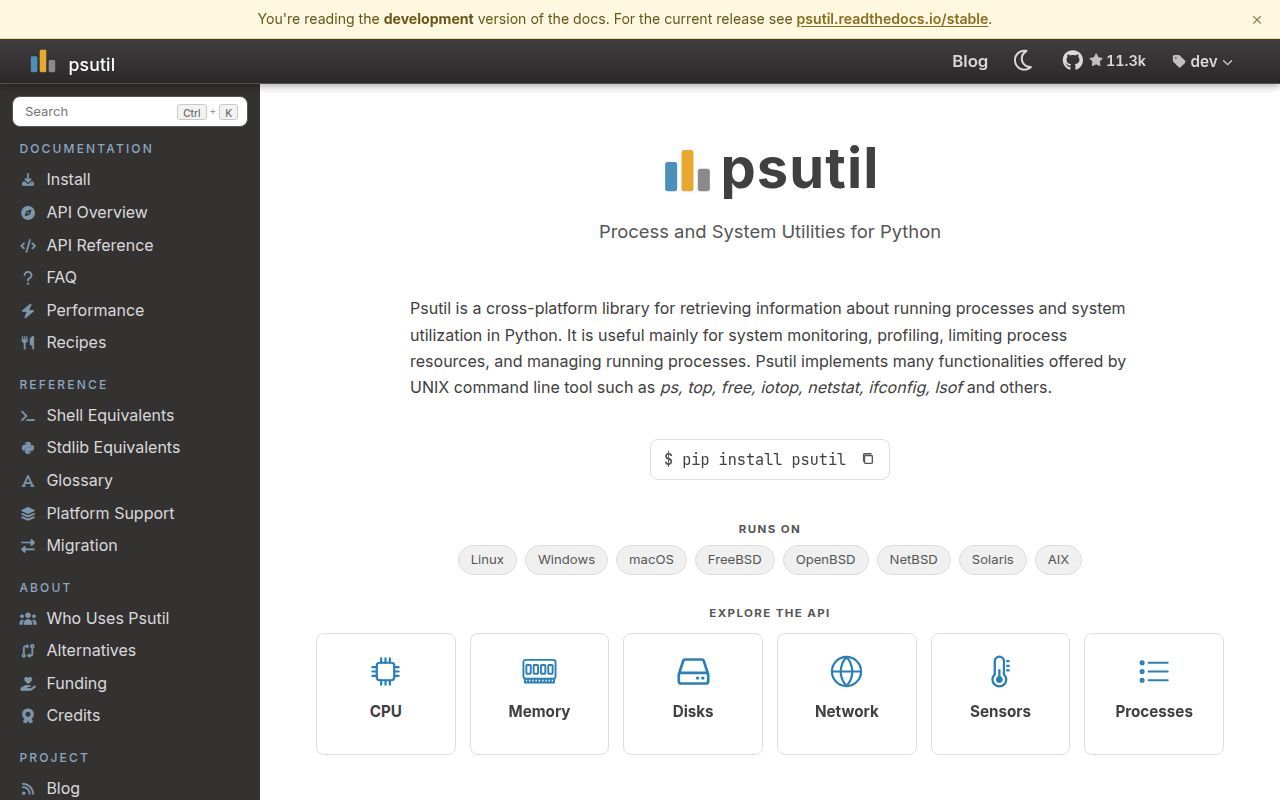
psutil 7.2.2 reads process and machine state through a Python API backed by operating-system calls. It covers CPU time and utilization, virtual and swap memory, disks, network interfaces and sockets, sensors, users, boot time, plus inspection and control of individual PIDs. The data replaces a lot of parsing around ps, top, free, netstat, ifconfig, and lsof, while preserving platform-specific fields and permission failures. In 7.2.2, Process.wait uses pidfd_open with poll on supported Linux systems and kqueue on macOS or BSD instead of a busy loop; the release also fixes several macOS error paths.
psutil 7.2.2 installed in 0.3 seconds, occupied 1 MB, and imported in 0.14 seconds in our sandbox, with 0 audit findings. Install it for cross-platform process and host inspection, provided your code expects permission failures, short-lived PIDs, native wheels, and container-specific limits.
We installed it
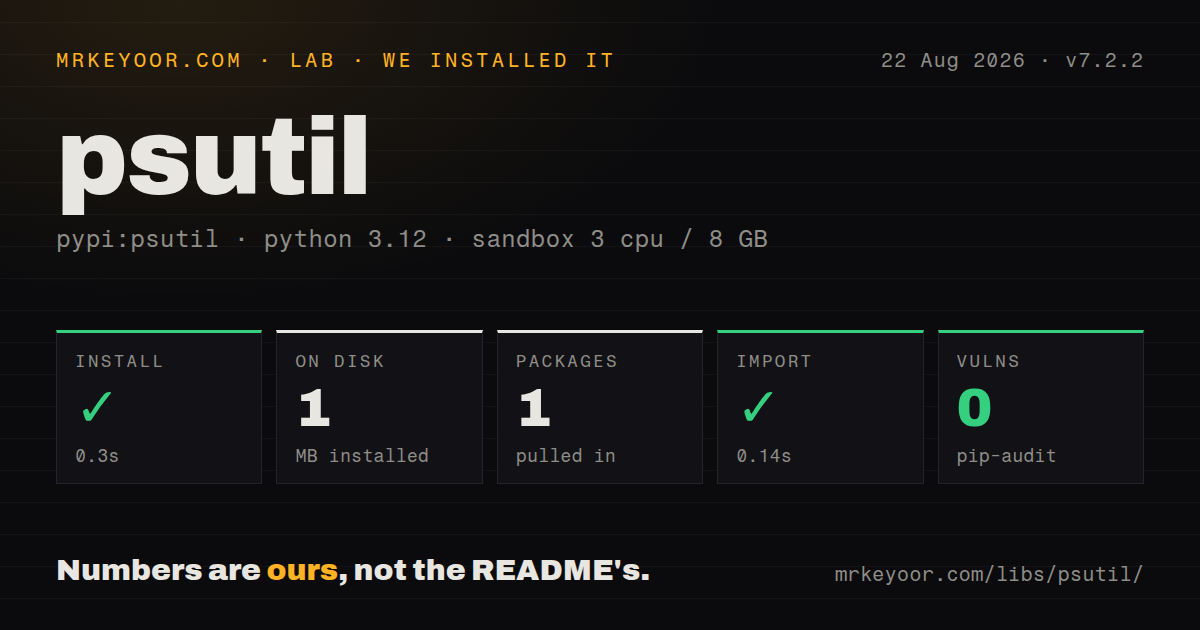
| Install | ✓ · 0.3s | 1 package on disk · 1 MB |
| Import | ✓ | import psutil in 0.14s · compiled extensions · requires Python >=3.6 |
| Known vulns | 0 | (pip-audit) |
Answers from our run
Does psutil install cleanly?
Yes. In a fresh container with an empty cache, pip install psutil finished in 0.3s, leaving 1 package and 1 MB on disk. pip-audit reported no known vulnerabilities.
What does psutil need to run?
Python >=3.6, and a platform wheel with compiled extensions. In our run import psutil succeeded in 0.14s.
psutil or py-cpuinfo: which should you use?
py-cpuinfo: Use it when you need static CPU model, vendor, architecture, and instruction flags rather than live utilization. psutil 7.2.2 installed in 0.3 seconds, occupied 1 MB, and imported in 0.14 seconds in our sandbox, with 0 audit findings.
When should you not use psutil?
You only need disk capacity or a CPU count; shutil.disk_usage() and os.cpu_count() already cover those standard-library cases
Discussed on
Use it if
- A Python diagnostics agent must inspect both host counters and individual processes on several operating systems
- A supervisor needs child discovery, signals, waiting, resource fields, files, or sockets attached to a PID
- You need rates derived from native CPU, disk, or network counters without scraping localized command output
- The calling code already treats vanished processes and denied fields as expected outcomes
- You only need disk capacity or a CPU count; shutil.disk_usage() and os.cpu_count() already cover those standard-library cases
- Autoscaling depends on container quotas; host-visible CPU and memory totals can differ from Linux cgroup limits and need a cgroup-aware collector
- GPU load or device memory is the target; psutil has no NVIDIA, AMD, or Intel GPU telemetry API
- Your runtime cannot load a wheel or compile C code; our 7.2.2 install contained .so extensions rather than a pure-Python implementation
- Every field must work with the same permissions on every supported OS; socket ownership, process environments, open files, and sensors have documented gaps
Setup reality
Our Python 3.12 sandbox installed psutil 7.2.2 in 0.3 seconds. One package remained and used 1 MB on disk; import psutil then took 0.14 seconds. pip-audit found 0 known vulnerabilities. The package requires Python 3.6 or newer, carries BSD-3-Clause licensing, includes compiled .so extensions, and has no py.typed marker. Its metadata has 38 direct dependency entries, all associated with development or test extras in the current PyPI record.
Published 7.2.2 wheels cover many common CPython, OS, architecture, and libc combinations. A deployment without a matching wheel must build the native extension, which means the local compiler and platform headers become part of installation. Confirm the exact image rather than assuming a wheel seen on another machine will apply. psutil needs no credentials or config file, but process details and system-wide connection tables may require elevated privileges.
Most values are either one-time snapshots or counters since boot. The first cpu_percent(interval=None) result is an unusable 0.0 because no earlier sample exists; discard it and sample again after at least 0.1 seconds, or pass a blocking interval. Compute disk and network rates from 2 counter readings plus monotonic elapsed time. For cross-platform memory pressure, the documentation points to available and percent instead of free alone.
A PID can disappear or be reused between 2 method calls. Catch NoSuchProcess, AccessDenied, and ZombieProcess at the point of access, and use process_iter(attrs=...) to reduce repeated lookups. oneshot() can share one kernel query across related properties. Version 7.2.2 makes waiting event-driven on Linux 5.3 with Python 3.9 or newer and on kqueue systems, with fallback behavior elsewhere. It does not turn the rest of the Process API into awaitable methods.
Patterns
Discard the first nonblocking CPU sample sample-system-cpu
import time
import psutil

psutil.cpu_percent(interval=None, percpu=True)
time.sleep(0.5)
percent_by_cpu = psutil.cpu_percent(interval=None, percpu=True)
The first interval=None call returns an unusable 0.0 because no previous CPU times exist. Leave at least 0.1 seconds between nonblocking samples.
Report memory available to new work read-memory-headroom
import psutil

memory = psutil.virtual_memory()
print({
    "available_bytes": memory.available,
    "used_percent": memory.percent,
    "swap_percent": psutil.swap_memory().percent,
})
The documentation recommends available and percent for cross-platform pressure checks. free alone excludes reclaimable memory differently across systems.
Turn byte counters into a receive rate calculate-network-throughput
import time
import psutil

before = psutil.net_io_counters()
started = time.monotonic()
time.sleep(1)
after = psutil.net_io_counters()
seconds = time.monotonic() - started
bytes_per_second = (after.bytes_recv - before.bytes_recv) / seconds
Network counters accumulate across the boot. Treat a negative delta as a reset caused by reboot or interface reinitialization.
Calculate disk writes per second measure-disk-io-rate
import time
import psutil

before = psutil.disk_io_counters()
t0 = time.monotonic()
time.sleep(1)
after = psutil.disk_io_counters()
write_rate = (after.write_bytes - before.write_bytes) / (time.monotonic() - t0)
disk_io_counters() returns cumulative values and may return None when the platform cannot provide them. Guard that case in portable collectors.
Fetch chosen attributes while processes change iterate-selected-process-fields
import psutil

for proc in psutil.process_iter(
    attrs=["pid", "name", "username", "status"],
    ad_value="<denied>",
):
    if proc.info["name"] == "python":
        print(proc.info)
attrs limits the requested work, and ad_value substitutes for AccessDenied or ZombieProcess on a field. Processes may still vanish during later calls.
Share kernel reads with oneshot batch-process-properties
import psutil

proc = psutil.Process(pid)
try:
    with proc.oneshot():
        snapshot = {
            "name": proc.name(),
            "status": proc.status(),
            "rss": proc.memory_info().rss,
        }
except (psutil.NoSuchProcess, psutil.AccessDenied):
    snapshot = None
oneshot() caches related values only inside its context. Which properties share a system call depends on the operating system.
Terminate a captured process tree stop-process-tree
import psutil

root = psutil.Process(pid)
targets = root.children(recursive=True) + [root]
for proc in targets:
    proc.terminate()
finished, alive = psutil.wait_procs(targets, timeout=5)
for proc in alive:
    proc.kill()
The children() result is a snapshot. A child created after that walk is absent from targets and needs separate supervision.
Separate an exited PID from denied access handle-process-errors
import psutil

try:
    command = psutil.Process(pid).cmdline()
except psutil.NoSuchProcess:
    command = None
except psutil.AccessDenied:
    command = ["<protected>"]
except psutil.ZombieProcess:
    command = ["<zombie>"]
Creating Process(pid) does not lock the process in place. The target may exit, become a zombie, or reject the following method.
Find TCP listeners visible to this user list-visible-tcp-listeners
import psutil

try:
    listeners = [
        conn for conn in psutil.net_connections(kind="tcp")
        if conn.status == psutil.CONN_LISTEN
    ]
except psutil.AccessDenied:
    listeners = []
System-wide connection results depend on operating system and privileges. A missing PID can mean that ownership was unavailable.
Start and wait for a child process monitor-child-process
import psutil

child = psutil.Popen(["python", "worker.py"])
try:
    code = child.wait(timeout=30)
except psutil.TimeoutExpired:
    child.terminate()
    try:
        code = child.wait(timeout=5)
    except psutil.TimeoutExpired:
        child.kill()
        code = child.wait()
psutil.Popen combines subprocess.Popen with Process methods. A wait timeout does not stop the child, so termination policy remains explicit.
Accept missing battery telemetry read-battery-status
import psutil

battery = psutil.sensors_battery()
if battery is None:
    status = {"available": False}
else:
    status = {
        "available": True,
        "percent": battery.percent,
        "plugged_in": battery.power_plugged,
    }
sensors_battery() returns None on a machine without a battery or a platform where psutil cannot read one.
Measure whether the native allocator released memory inspect-native-heap
import psutil

if hasattr(psutil, "heap_info") and hasattr(psutil, "heap_trim"):
    before = psutil.heap_info()
    trimmed = psutil.heap_trim()
    after = psutil.heap_info()
heap_info() and heap_trim() were added in 7.2 and depend on the native allocator. Guard them and compare results on the deployed platform.
Alternatives
| Package | Registry | Pick it when |
|---|---|---|
| py-cpuinfo | PyPI | Use it when you need static CPU model, vendor, architecture, and instruction flags rather than live utilization. |
| prometheus-client | PyPI | Use it to expose application metrics in Prometheus format; add a separate collector for host and process measurements. |
| nvidia-ml-py | PyPI | Use it for NVIDIA GPU utilization, temperature, running processes, and device memory that psutil does not report. |
More infra guides
boto3 · opentelemetry-api · distro · @opentelemetry/api · google-cloud-storage · @aws-sdk/client-s3 · the whole shelf →
How this guide is made: grounded in the library's documentation, release notes, changelog, and issue history, on a fixed rubric — not a hands-on install of every release. The 50 most-downloaded entries are additionally install-verified in clean containers. Corrections: contact the desk.