dd-trace review
Our dd-trace 6.12.0 install was a 101 MB, Node-only addition that connects a Node process to Datadog APM. Load it before the application and it patches supported HTTP servers, frameworks, database clients, queues, and loggers as those modules initialize. You can add spans with trace() or startSpan(), attach tags, control sampling, and enable Datadog products such as profiling, AppSec, runtime metrics, and LLM Observability. The 6.12.0 release adds WAF and RASP timing metrics, feature-flag exposure routing, LLM dataset record tags, and lower carrier-extraction overhead. Its output and configuration assume a Datadog Agent, so this is an observability vendor client rather than a portable telemetry layer.
dd-trace 6.12.0 took 11.8 seconds and 101 MB in our sandbox, passed npm audit, and failed a browser bundle, which makes it a serious Node-only agent for teams already committed to Datadog. Start with OpenTelemetry when backend choice matters more than Datadog's automatic integrations and product switches.
We installed it
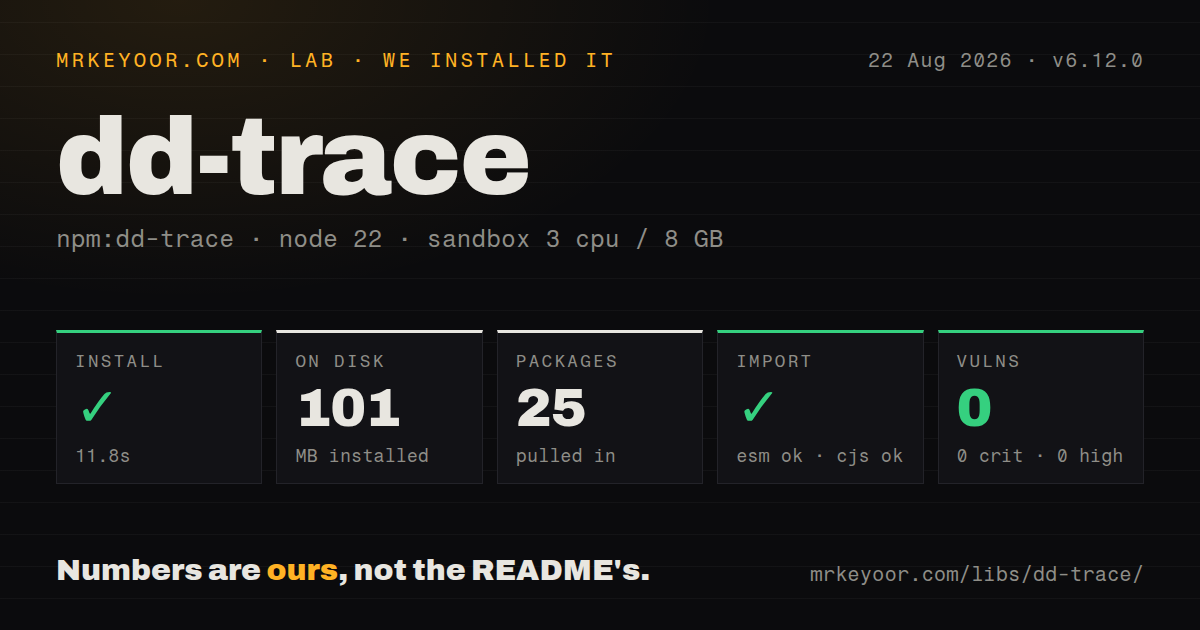
| Install | ✓ · 11.8s | 25 packages on disk · 101 MB |
| Import | ✓ | ESM import works · require() works · CommonJS package |
| Browser | n/a | could not be bundled for the browser (Node-only code, most likely) |
| Types | ✓ | TypeScript types bundled |
| Known vulns | 0 | 0 critical · 0 high · 0 moderate · 0 low (npm audit) |
Answers from our run
Does dd-trace install cleanly?
Yes. In a fresh container with an empty cache, npm install dd-trace finished in 12 seconds, leaving 25 packages and 101 MB on disk. npm audit reported no known vulnerabilities.
Can dd-trace run in a browser?
Not directly: esbuild could not bundle it for the browser in our run, which normally means it depends on Node built-ins. Use it on the server, or find a browser-targeted alternative.
Does dd-trace work with both ESM and CommonJS?
Yes. Both import 'dd-trace' and require('dd-trace') worked in Node 22 in our run. The package is published as CommonJS.
Does dd-trace include TypeScript types?
Yes, type declarations ship inside the package, so no @types install is needed.
dd-trace or @opentelemetry/sdk-node: which should you use?
@opentelemetry/sdk-node: Use it when OTLP output and the option to change observability backends are requirements. dd-trace 6.12.0 took 11.8 seconds and 101 MB in our sandbox, passed npm audit, and failed a browser bundle, which makes it a serious Node-only agent for teams already committed to Datadog.
When should you not use dd-trace?
Telemetry must switch among OTLP, Jaeger, or another backend without replacing the SDK; this tracer sends through Datadog's Agent and uses Datadog-specific controls
Use it if
- Datadog already receives your production telemetry and you want supported Node modules instrumented at load time
- Trace and span identifiers need to appear in pino, winston, or bunyan records sent to Datadog Logs
- One Node agent should supply APM plus optional profiling, AppSec, and runtime metrics
- Automatic spans cover most calls, while your application still needs named spans around jobs or business operations
- Telemetry must switch among OTLP, Jaeger, or another backend without replacing the SDK; this tracer sends through Datadog's Agent and uses Datadog-specific controls
- Your runtime is Node 20 or earlier; dd-trace 6 declares Node 22 as its minimum, and the README puts Node 18 users on the v5 maintenance line
- An extra 101 MB in the deployment image is unacceptable; that is what our clean 6.12.0 installation occupied
- The production server is bundled without room for Datadog's esbuild or webpack treatment and external native modules; module patching depends on preserving load boundaries
- AWS Lambda is the main target and you want platform setup in this package alone; the README directs Lambda deployments to the separate datadog-lambda-js integration
Setup reality
We installed dd-trace 6.12.0 in 11.8 seconds on a clean Node 22 Bookworm container. The result was 25 packages and 101 MB on disk. Its own package is 11,504 KB unpacked, with 3 direct dependencies, no peers, bundled declarations, and zero npm audit findings. CommonJS require and ESM import worked. A browser build failed because esbuild reached Node-only code.
Initialization order decides whether automatic spans appear. CommonJS services can start with --require dd-trace/init; ESM services need --import dd-trace/initialize.mjs. Both forms run before application imports. If Express or pg loads first, calling init() later cannot reliably patch work that already happened. Version 6 also requires Node 22 or newer.
Traces normally leave the process through a reachable Datadog Agent on port 8126. Runtime metrics take a separate DogStatsD path on port 8125. Set DD_SERVICE, DD_ENV, and DD_VERSION at deployment time so releases do not collapse into one service view. Datadog credentials belong with the Agent or its platform integration, rather than inside tracer setup.
Bundling needs deliberate treatment even though direct Node imports succeeded. Datadog supplies an esbuild plugin, and profiler or AppSec native modules must remain external and present in the runtime image. Sampling rules also affect the bill and incident detail. Exclude predictable traffic such as health checks only after confirming the resource names emitted by your framework integration; 6.12.0 improves extraction work but does not set a suitable retention policy.
Patterns
Start a CommonJS service with tracing preload-commonjs
DD_SERVICE=orders-api \
DD_ENV=production \
DD_VERSION=2.7.0 \
NODE_OPTIONS='--require dd-trace/init' node server.js
The preload executes before server.js requires Express, database drivers, or loggers, which gives dd-trace a chance to patch them.
Start an ESM service with loader hooks preload-esm
DD_SERVICE=orders-api \
DD_ENV=production \
NODE_OPTIONS='--import dd-trace/initialize.mjs' node server.mjs
ESM applications need initialize.mjs at process startup; a normal import inside server.mjs runs after that module's static dependencies have loaded.
Configure the tracer before other modules initialize-with-code
// tracing.cjs
module.exports = require('dd-trace').init({
  service: 'billing-worker',
  env: process.env.NODE_ENV,
  logInjection: true
})

// worker.cjs
require('./tracing.cjs')
const { Worker } = require('bullmq')
The first require must stay above instrumented libraries; moving BullMQ ahead of it can leave the queue client unpatched.
Trace an asynchronous operation trace-promise
const tracer = require('dd-trace')

async function reserve(order) {
  return tracer.trace('inventory.reserve', {
    resource: order.warehouse
  }, async (span) => {
    span.setTag('order.item_count', order.items.length)
    return inventory.reserve(order.items)
  })
}
trace() activates the span for the callback and closes it when the returned promise settles; a rejection is recorded and rethrown.
Activate and finish a manual span manage-span-lifecycle
const span = tracer.startSpan('job.consume', {
  tags: { 'queue.name': job.queueName }
})

await tracer.scope().activate(span, async () => {
  try {
    await processJob(job)
  } catch (error) {
    span.setTag('error', error)
    throw error
  } finally {
    span.finish()
  }
})
startSpan() does not activate or finish its span; the scope call supplies parent context, and finally closes the span on both outcomes.
Attach application context tag-active-span
const span = tracer.scope().active()
if (span) {
  span.setTag('account.tier', account.tier)
  span.setTag('cart.item_count', cart.items.length)
}
active() returns null when no traced scope exists. Keep secrets and unbounded identifiers out of tags because Datadog indexes or retains this data.
Keep payments and drop health checks set-sampling-rules
require('dd-trace').init({
  sampleRate: 0.25,
  samplingRules: [
    { sampleRate: 0, resource: 'GET /healthz' },
    { sampleRate: 1, name: 'payment.capture' }
  ],
  rateLimit: 200
})
Rules match emitted operation and resource names. Inspect live traces first because each framework plugin decides its resource string.
Correlate supported logs with traces inject-log-context
require('dd-trace').init({ logInjection: true })

const pino = require('pino')
const log = pino()
log.info({ orderId }, 'order accepted')
The tracer must load before pino for automatic injection, and the resulting identifiers help only when the logs and traces reach Datadog.
Give PostgreSQL spans a service name configure-integration
const tracer = require('dd-trace').init()
tracer.use('pg', {
  service: 'orders-postgres'
})

const { Pool } = require('pg')
Call use() before requiring pg. Plugin options apply to the named integration rather than changing every database span.
Enable metrics and profiling enable-runtime-products
require('dd-trace').init({
  runtimeMetrics: true,
  profiling: true
})
Runtime metrics require DogStatsD on port 8125, separate from trace intake on 8126. Profiling can load an optional native package.
Reach an Agent from a container set-agent-address
DD_AGENT_HOST=datadog-agent \
DD_TRACE_AGENT_PORT=8126 \
DD_SERVICE=catalog-api \
NODE_OPTIONS='--require dd-trace/init' node app.js
Inside a container, localhost usually names that same container. Use an Agent hostname reachable on the deployment network.
Keep Datadog hooks in an esbuild output bundle-node-service
const esbuild = require('esbuild')
const datadog = require('dd-trace/esbuild')

esbuild.build({
  entryPoints: ['src/server.js'],
  platform: 'node',
  bundle: true,
  outfile: 'dist/server.js',
  plugins: [datadog],
  external: [
    '@datadog/pprof',
    '@datadog/native-appsec',
    '@datadog/native-metrics'
  ]
})
Native Datadog modules stay outside the bundle and must still be installed beside the deployed output. Our ordinary browser-target bundle failed.
Alternatives
| Package | Registry | Pick it when |
|---|---|---|
| @opentelemetry/sdk-node | npm | Use it when OTLP output and the option to change observability backends are requirements |
| elastic-apm-node | npm | Use it when Elastic already stores the application's logs, metrics, and traces |
| newrelic | npm | Use it when New Relic owns your APM dashboards and alert workflow |
| @prometheus-io/client | npm | Use it when exported application metrics are enough and distributed tracing is unnecessary |
More infra guides
boto3 · opentelemetry-api · psutil · distro · @opentelemetry/api · google-cloud-storage · the whole shelf →
How this guide is made: grounded in the library's documentation, release notes, changelog, and issue history, on a fixed rubric — not a hands-on install of every release. The 50 most-downloaded entries are additionally install-verified in clean containers. Corrections: contact the desk.