opentelemetry-api review
opentelemetry-api defines vendor-neutral Python interfaces for traces, metrics, context, baggage, and propagation. It includes no-op providers so libraries can create spans or measurements without choosing a collector, exporter, sampling policy, or observability vendor. An application installs and configures opentelemetry-sdk or another implementation to make those calls produce data. Version 1.44 removes the deprecated Events API in favor of log records with event_name, requires EnvironmentGetter to receive the environment mapping explicitly, and prevents inherited dict methods from mutating Context in place. Traces and metrics are stable; the project still marks logs as development.
opentelemetry-api 1.44.0 installed in 0.2 seconds as two packages using 1 MB, imported in 0.02 seconds, and produced no audit findings in our sandbox. That tiny dependency is right for library telemetry hooks, but applications still need an SDK, exporter, service identity, and shutdown path before a backend receives anything.
We installed it
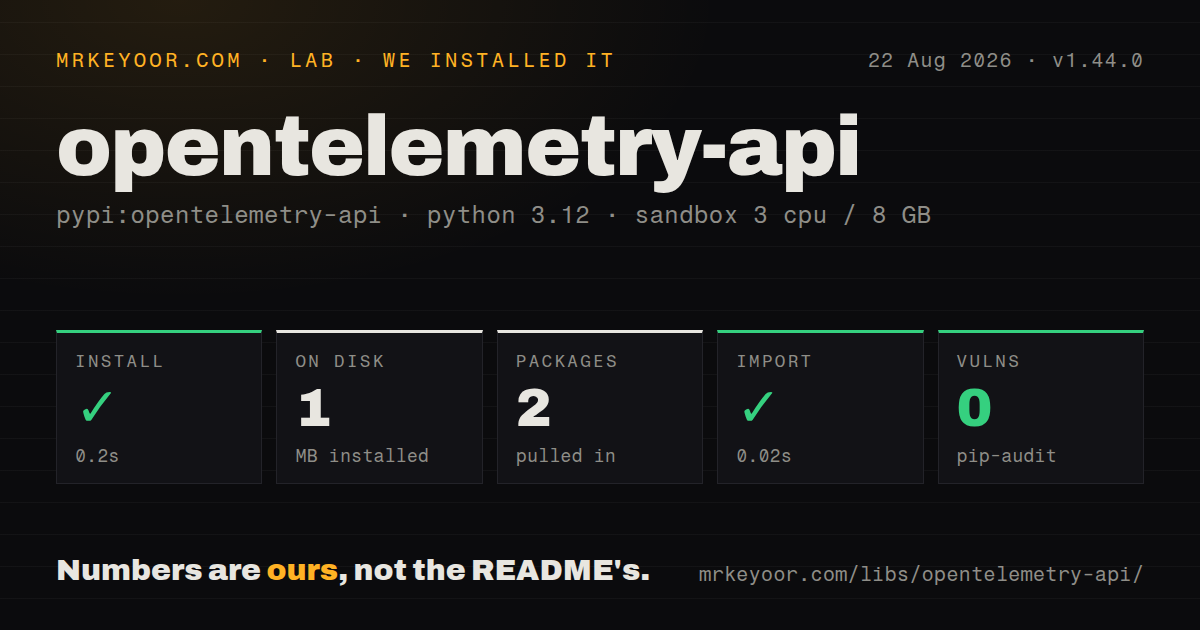
| Install | ✓ · 0.2s | 2 packages on disk · 1 MB |
| Import | ✓ | import opentelemetry in 0.02s · pure Python · py.typed · requires Python >=3.10 |
| Known vulns | 0 | (pip-audit) |
Answers from our run
Does opentelemetry-api install cleanly?
Yes. In a fresh container with an empty cache, pip install opentelemetry-api finished in 0.2s, leaving 2 packages and 1 MB on disk. pip-audit reported no known vulnerabilities.
What does opentelemetry-api need to run?
Python >=3.10, and nothing compiled: it is pure Python. In our run import opentelemetry succeeded in 0.02s, and the package ships py.typed for type checkers.
opentelemetry-api or opentelemetry-sdk: which should you use?
opentelemetry-sdk: Install it in applications that need the reference providers, processors, sampling, and in-process aggregation behind this API. opentelemetry-api 1.44.0 installed in 0.2 seconds as two packages using 1 MB, imported in 0.02 seconds, and produced no audit findings in our sandbox.
When should you not use opentelemetry-api?
You expect this package alone to export telemetry; its default tracer and meter providers intentionally produce no data
Use it if
- A reusable library should emit spans or metrics without forcing an SDK, exporter, agent, or vendor on applications
- Services in several languages need W3C trace propagation and a shared telemetry vocabulary
- An application wants manual instrumentation that can be exported through OTLP to different backends
- Context and baggage must cross async call chains or custom transports using the OpenTelemetry propagation model
- You expect this package alone to export telemetry; its default tracer and meter providers intentionally produce no data
- A small script only needs logs or a duration line; provider, processor, resource, exporter, sampling, and shutdown concepts add real setup
- Stable logging APIs are mandatory; the project status still labels logs development and warns about breaking work during stabilization
- You only need low-cardinality process metrics for Prometheus and do not need distributed context; prometheus-client is more direct
- Your team wants first-party vendor instrumentation and accepts that lock-in; a vendor agent may require fewer packages and less collector configuration
Setup reality
Our fresh Python 3.12 install of opentelemetry-api 1.44.0 succeeded in 0.2 seconds. Two packages used 1 MB, and pip-audit reported no known vulnerabilities. The package metadata lists one direct dependency, requires Python 3.10 or newer, is pure Python, and ships py.typed. Its measured license field was unknown. Importing opentelemetry worked in 0.02 seconds. This small result covers interfaces and no-op implementations, not a working export pipeline.
Applications usually add opentelemetry-sdk, one or more exporter distributions, and separate instrumentation packages. Set a TracerProvider and MeterProvider once near process startup, attach processors and exporters, and identify the service through Resource attributes such as service.name. OTLP over HTTP and OTLP over gRPC use different exporter modules and dependencies. Libraries should stay on opentelemetry-api only; importing SDK classes from library code takes deployment choice away from the application.
The default provider silently discards spans and measurements. That is useful for library authors and confusing during local verification, so start with a console exporter or an in-memory exporter in tests. Batch processors buffer data; applications must allow shutdown or call force_flush during controlled termination. Forking, short-lived jobs, serverless freezes, and abrupt worker exits can lose pending telemetry. Export failures should not take down request handling, but a broken pipeline can also fail quietly unless its own logs and health are monitored.
Context follows contextvars across await points and must be attached and detached carefully around manual propagation. Version 1.44 makes Context resist inherited dict mutation, reinforcing its immutable usage model. Baggage travels in request headers and must not contain secrets or unbounded user data. Span and metric attributes need low, controlled cardinality; user IDs, URLs with identifiers, and full exception messages can produce high cost or leak data. When OTEL_CONFIG_FILE is used by the SDK configuration layer, Python-specific environment initialization rules may be bypassed, so do not mix configuration styles casually.
Patterns
Wrap work in a trace span create-current-span
from opentelemetry import trace

tracer = trace.get_tracer('orders.library', '1.0.0')

with tracer.start_as_current_span('calculate-total') as span:
    span.set_attribute('order.item_count', len(items))
    total = calculate(items)
This is a no-op until the application installs a real TracerProvider. Library code should accept that behavior.
Annotate a caught failure record-handled-exception
from opentelemetry.trace import Status, StatusCode

with tracer.start_as_current_span('charge') as span:
    try:
        charge_card()
    except PaymentError as error:
        span.record_exception(error)
        span.set_status(Status(StatusCode.ERROR, 'payment rejected'))
        raise
start_as_current_span records uncaught exceptions by default. Explicit calls matter when you catch or translate them.
Mark an instant inside a span add-span-event
with tracer.start_as_current_span('refresh-cache') as span:
    span.add_event('lookup-started', {'cache.backend': 'redis'})
    value = refresh()
    span.add_event('lookup-finished', {'cache.hit': value is not None})
Use a child span when the substep has duration worth measuring. Keep event attributes bounded.
Record a counter and histogram create-metric-instruments
from opentelemetry import metrics

meter = metrics.get_meter('orders.library', '1.0.0')
processed = meter.create_counter('orders.processed', unit='{order}')
duration = meter.create_histogram('orders.duration', unit='ms')

processed.add(1, {'region': 'eu'})
duration.record(elapsed_ms, {'region': 'eu'})
A no-op MeterProvider discards these calls. Never use order IDs or customer IDs as metric attributes.
Write trace headers for a custom client inject-http-context
from opentelemetry.propagate import inject

headers = {}
inject(headers)
response = custom_http_client.get(url, headers=headers)
Standard HTTP instrumentors already inject headers. Manual injection is for transports they do not cover.
Continue an incoming trace extract-remote-context
from opentelemetry.propagate import extract

parent_context = extract(request_headers)
with tracer.start_as_current_span('consume-message', context=parent_context):
    handle(payload)
Treat incoming carrier values as untrusted. The propagator validates format, while application auth remains separate.
Scope baggage to one call chain attach-baggage
from opentelemetry import baggage, context

ctx = baggage.set_baggage('tenant.plan', 'business')
token = context.attach(ctx)
try:
    call_downstream()
finally:
    context.detach(token)
Baggage may be transmitted in plaintext headers. Keep it small and exclude secrets or personal identifiers.
Annotate the active span in a helper read-current-span
from opentelemetry import trace

def note_cache_result(hit: bool) -> None:
    span = trace.get_current_span()
    if span.is_recording():
        span.set_attribute('cache.hit', hit)
is_recording avoids building expensive attribute values for a non-recording or no-op span.
Install a real provider in the application configure-trace-sdk
from opentelemetry import trace
from opentelemetry.sdk.resources import Resource
from opentelemetry.sdk.trace import TracerProvider
from opentelemetry.sdk.trace.export import BatchSpanProcessor, ConsoleSpanExporter

provider = TracerProvider(resource=Resource.create({
    'service.name': 'orders-api',
}))
provider.add_span_processor(BatchSpanProcessor(ConsoleSpanExporter()))
trace.set_tracer_provider(provider)
This requires opentelemetry-sdk and belongs at application startup. Replace the console exporter for production.
Finish buffered spans in a short job flush-before-exit
provider = trace.get_tracer_provider()
try:
    run_job()
finally:
    provider.force_flush(timeout_millis=5_000)
    provider.shutdown()
These methods come from an SDK provider, not the no-op API contract. Keep the concrete provider handle when static typing matters.
Alternatives
| Package | Registry | Pick it when |
|---|---|---|
| opentelemetry-sdk | PyPI | Install it in applications that need the reference providers, processors, sampling, and in-process aggregation behind this API |
| structlog | PyPI | Choose it when structured application logging is the goal and distributed traces or metrics are unnecessary |
| prometheus-client | PyPI | Choose it for direct Prometheus counters, gauges, summaries, and histograms without an OpenTelemetry pipeline |
More infra guides
boto3 · @opentelemetry/api · psutil · distro · @aws-sdk/client-s3 · google-cloud-storage · the whole shelf →
How this guide is made: grounded in the library's documentation, release notes, changelog, and issue history, on a fixed rubric — not a hands-on install of every release. The 50 most-downloaded entries are additionally install-verified in clean containers. Corrections: contact the desk.