logfire review
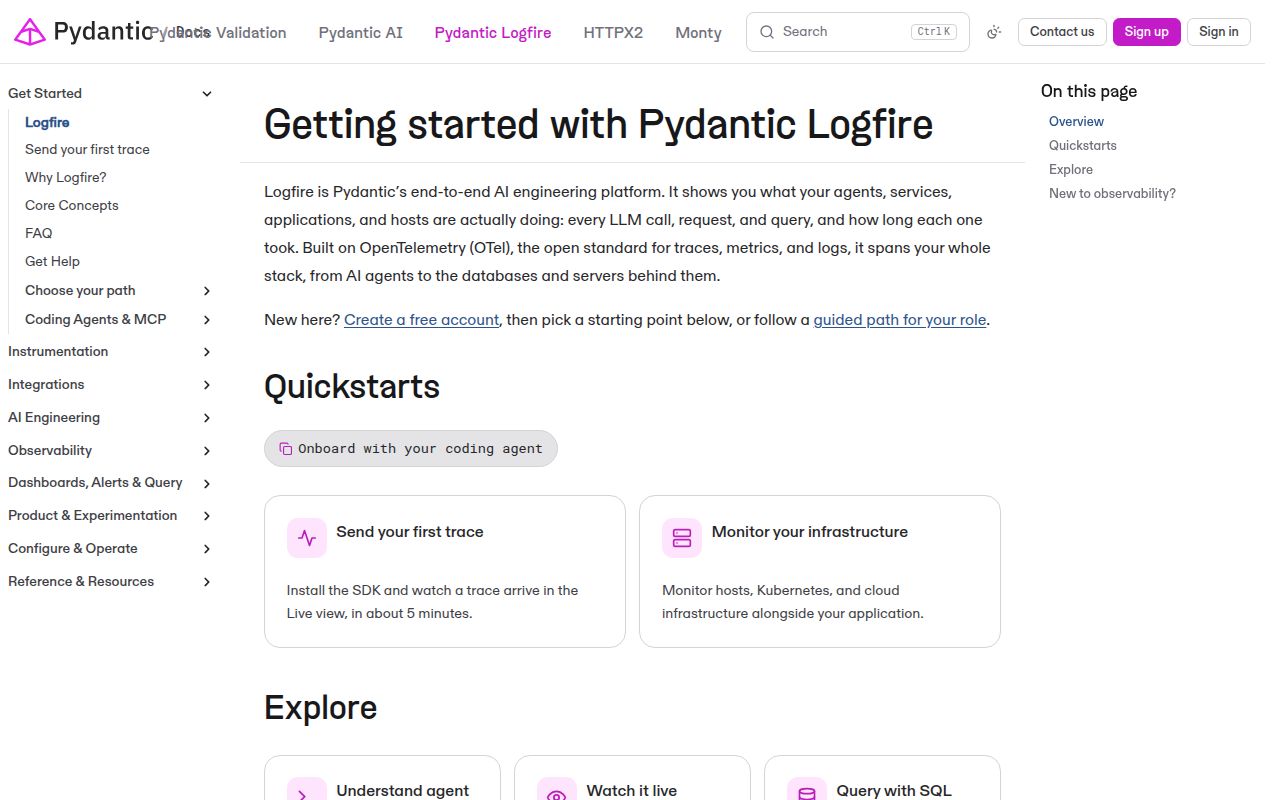
Logfire 4.41.0 is Pydantic's Python SDK for logs, traces, and metrics, plus a hosted service that stores and queries the telemetry. The open-source package wraps OpenTelemetry and adds structured messages, spans, scrubbing, metrics, and instrumentation for Python frameworks, databases, HTTP clients, task queues, Pydantic, and AI SDKs. The dashboard and ingestion backend are closed source; exporting the SDK's data to another OpenTelemetry backend is supported. Version 4.41.0 fixes two Claude Agent SDK races, corrects async callback parenting, speeds default scrub matching, bounds INSERT summaries, adds outbound HTTP timeouts, and makes non-interactive CLI use practical.
Logfire 4.41.0 installed in 0.4 seconds and imported in 0.92 seconds, but our base environment grew to 23 packages and 19 MB. It fits Python teams that want opinionated OpenTelemetry plus strong framework instrumentation; skip it for plain logging or when a closed-source hosted backend and broad capture surface fail your data policy.
We installed it
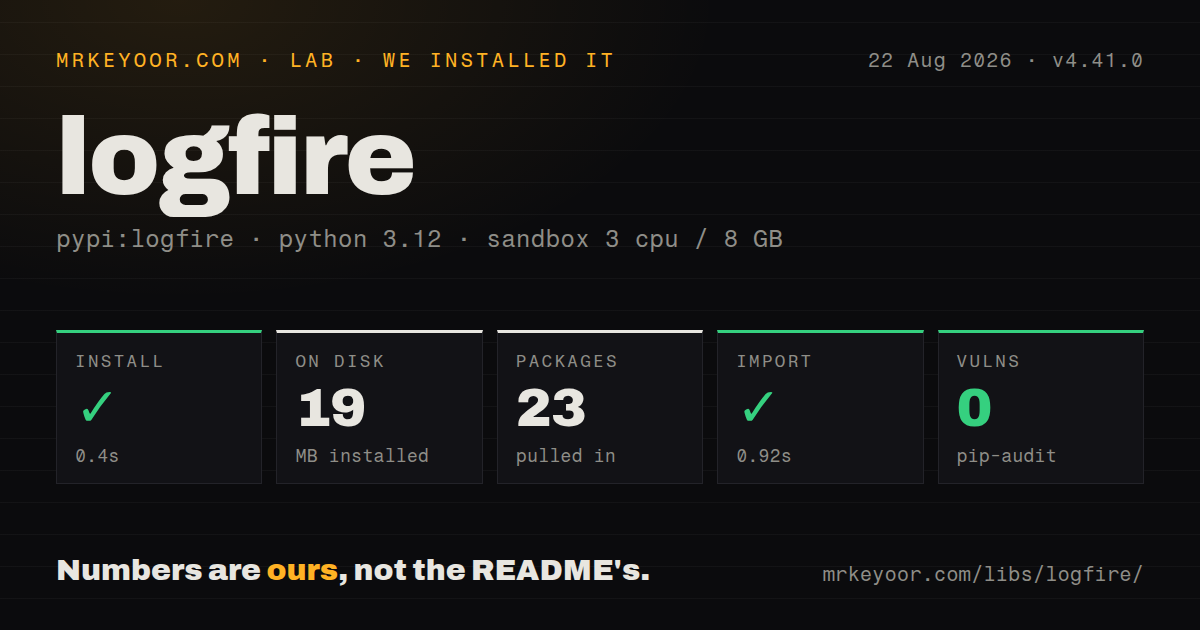
| Install | ✓ · 0.4s | 23 packages on disk · 19 MB |
| Import | ✓ | import logfire in 0.92s · pure Python · py.typed · requires Python >=3.10 |
| Known vulns | 0 | (pip-audit) |
Answers from our run
Does logfire install cleanly?
Yes. In a fresh container with an empty cache, pip install logfire finished in 0.4s, leaving 23 packages and 19 MB on disk. pip-audit reported no known vulnerabilities.
What does logfire need to run?
Python >=3.10, and nothing compiled: it is pure Python. In our run import logfire succeeded in 0.92s, and the package ships py.typed for type checkers.
logfire or opentelemetry-sdk: which should you use?
opentelemetry-sdk: Choose it for vendor-neutral primitives when your team will own resources, processors, exporters, and instrumentation. Logfire 4.41.0 installed in 0.4 seconds and imported in 0.92 seconds, but our base environment grew to 23 packages and 19 MB.
When should you not use logfire?
A fully open-source server and UI are mandatory. The repository says Logfire's backend is closed source and self-hosting is sold under an enterprise license.
Use it if
- A Python service needs logs, traces, and metrics under one API without hand-assembling each OpenTelemetry processor and exporter.
- Your stack uses FastAPI, Pydantic, HTTPX, requests, SQLAlchemy, Redis, Celery, or a supported AI SDK whose calls should become spans.
- The team accepts the hosted Logfire service or has an OpenTelemetry backend ready for the open-source SDK.
- Local console telemetry and production export should share the same instrumented code paths.
- A fully open-source server and UI are mandatory. The repository says Logfire's backend is closed source and self-hosting is sold under an enterprise license.
- Your organization already owns a stable OpenTelemetry SDK and collector setup. Logfire adds its configuration, instrumentation wrappers, and release cadence on top.
- The requirement is only structured application logs. Our base install used 19 MB across 23 packages, far beyond `structlog` or the standard library's narrower job.
- Telemetry cannot leave the environment and nobody will review captured arguments, headers, SQL, model values, or AI content. Default scrubbing does not replace that audit.
- A slow-moving API surface is required. The 4.x line frequently adds integrations, AI attributes, managed variables, query features, and configuration options, with documented deprecations along the way.
Setup reality
We installed logfire 4.41.0 in 0.4 seconds in a fresh Python 3.12 Bookworm sandbox. It left 23 packages and 19 MB on disk, declared 44 direct dependencies, and pip-audit reported 0 known vulnerabilities. import logfire worked and took 0.92 seconds in that sandbox. The distribution is pure Python, requires Python 3.10 or newer, and ships py.typed. Its package license metadata was unknown in our measurement.
The hosted route needs a Logfire account, a project, and a write token. A developer can run logfire auth; deployed services normally receive LOGFIRE_TOKEN as a secret. Call logfire.configure() before instrumentation and set service name, version, and environment early. Hosted sending is the default, so local or test code should choose send_to_logfire=False or if-token-present when an absent token must not trigger export setup.
Automatic instrumentation can record request data, headers when enabled, SQL details, function arguments, exceptions, validation inputs, and AI prompts or responses. Configure scrubbing and capture options before production traffic. Default patterns are a fallback, not a data-policy review. Distributed trace headers can also join local spans to an untrusted caller's trace, so set the distributed-tracing policy instead of accepting propagation without thought. Version 4.41.0 improves scrub matching but does not change that boundary.
Framework hooks often need extras that install their matching OpenTelemetry instrumentation package. Call each global instrumentor once during startup and before creating long-lived clients. Short commands should call force_flush() or shut providers down so buffered exports are sent. For another backend, disable hosted sending and provide span processors or metric readers; installing Logfire alone does not create a collector. The 4.41.0 CLI adds JSON project listing, project status, non-interactive mode, and authentication that can finish without a TTY.
Patterns
Name a service before hosted export starts configure-hosted-service
import logfire

logfire.configure(
    service_name='checkout-api',
    service_version='2026.08.26',
    environment='production',
)
Hosted sending is the default and reads `LOGFIRE_TOKEN`. Inject that write token as a deployment secret before configuration runs.
Keep a local run out of the hosted project run-console-only
import logfire

logfire.configure(
    service_name='checkout-api',
    send_to_logfire=False,
)
This preserves console output but does not route telemetry to another backend. Add your own OpenTelemetry processors or readers for that.
Attach queryable fields to a log message write-structured-event
logfire.info(
    'Checkout created for {user_id}',
    user_id='usr_42',
    checkout_id='chk_17',
    total_cents=2599,
)
Template fields become attributes as well as rendered text. Avoid secrets and identifiers that your retention policy does not permit.
Put child events inside an operation span trace-operation
with logfire.span('Charge order {order_id}', order_id=order.id):
    result = gateway.charge(order.total)
    logfire.info(
        'Gateway accepted charge',
        transaction_id=result.id,
    )
Logs inside the context inherit the active span. Values placed on the span can reach every configured exporter, so scrub or omit sensitive fields.
Trace calls to one Python function instrument-function
@logfire.instrument(
    'Calculate quote for {destination}',
    record_return=False,
)
def calculate_quote(destination: str, weight_kg: float) -> int:
    return pricing.lookup(destination, weight_kg)
Function instrumentation can capture arguments. Select fields or disable extraction when parameters are sensitive, large, or high volume.
Send a handled exception with its traceback record-current-exception
try:
    process_payment()
except PaymentError:
    logfire.exception(
        'Payment processing failed',
        order_id=order.id,
    )
    raise
Call `exception()` while the exception is active so its traceback is available. Reraise when telemetry should not alter the application's failure contract.
Trace FastAPI routes except health checks instrument-fastapi
import logfire
from fastapi import FastAPI

logfire.configure(service_name='orders-api')
app = FastAPI()
logfire.instrument_fastapi(
    app,
    excluded_urls='health|metrics',
)
Install the `fastapi` extra or matching OpenTelemetry instrumentation. Header capture is separate and should remain off until its data has been reviewed.
Trace outgoing HTTPX requests instrument-httpx
import httpx
import logfire

logfire.instrument_httpx()
response = httpx.get(
    'https://inventory.example.com/items/42'
)
Run the global hook once at startup before building long-lived clients. Repeating instrumentation can yield duplicate spans.
Record only failed Pydantic validations instrument-pydantic
import logfire

logfire.configure()
logfire.instrument_pydantic(record='failure')

# Define and validate models after instrumentation is active.
`failure` is the lower-volume starting point. Recording successful validation can expose model fields and greatly increase telemetry.
Route standard logging records through Logfire forward-standard-logs
import logging
import logfire

logging.basicConfig(
    handlers=[logfire.LogfireLoggingHandler()]
)
logging.getLogger('worker').warning(
    'retrying delivery',
    extra={'order_id': 'ord_9'},
)
Check existing handlers and logger propagation first. Otherwise one record can appear several times in the console or exporter.
Count accepted orders with a bounded label increment-counter
orders = logfire.metric_counter(
    'orders.processed',
    unit='1',
    description='Processed orders',
)
orders.add(1, {'result': 'accepted'})
Each attribute combination can create a metric series. Keep request IDs, user IDs, and other unbounded values out of metric labels.
Flush buffered telemetry before process exit flush-batch-job
try:
    run_batch()
finally:
    if not logfire.force_flush(timeout_millis=5000):
        print('telemetry flush timed out')
Batch exporters hold recent records in memory. A short process can finish successfully and still lose its last spans unless it flushes or shuts providers down.
Alternatives
| Package | Registry | Pick it when |
|---|---|---|
| opentelemetry-sdk | PyPI | Choose it for vendor-neutral primitives when your team will own resources, processors, exporters, and instrumentation. |
| sentry-sdk | PyPI | Choose it when exception triage and performance traces matter more than a general telemetry and SQL-query platform. |
| structlog | PyPI | Choose it for structured Python logs without adopting traces, metrics, a collector, or a hosted observability product. |
More infra guides
boto3 · opentelemetry-api · psutil · distro · @opentelemetry/api · google-cloud-storage · the whole shelf →
How this guide is made: grounded in the library's documentation, release notes, changelog, and issue history, on a fixed rubric — not a hands-on install of every release. The 50 most-downloaded entries are additionally install-verified in clean containers. Corrections: contact the desk.