sentry-sdk review
sentry-sdk is Sentry's official Python client for sending exceptions, messages, logs, traces, profiles, metrics, and check-ins to a Sentry project. Framework integrations add request, task, database, and outbound-call context, while scopes attach users, tags, breadcrumbs, and custom fields to events. Version 2.68.0 changes log and metric control: enable_logs and enable_metrics are now no-ops; automatic logging and Loguru collection require capture_sentry_logs=True on their integrations, while direct logger and metrics API calls send without those switches. Our install was pure Python, typed, and imported successfully.
Sentry's SDK is a strong fit when the organization has chosen Sentry and wants framework-aware error context. Version 2.68.0 makes log and metric settings an upgrade checkpoint, and no production rollout should skip the data-scrubbing review.
We installed it
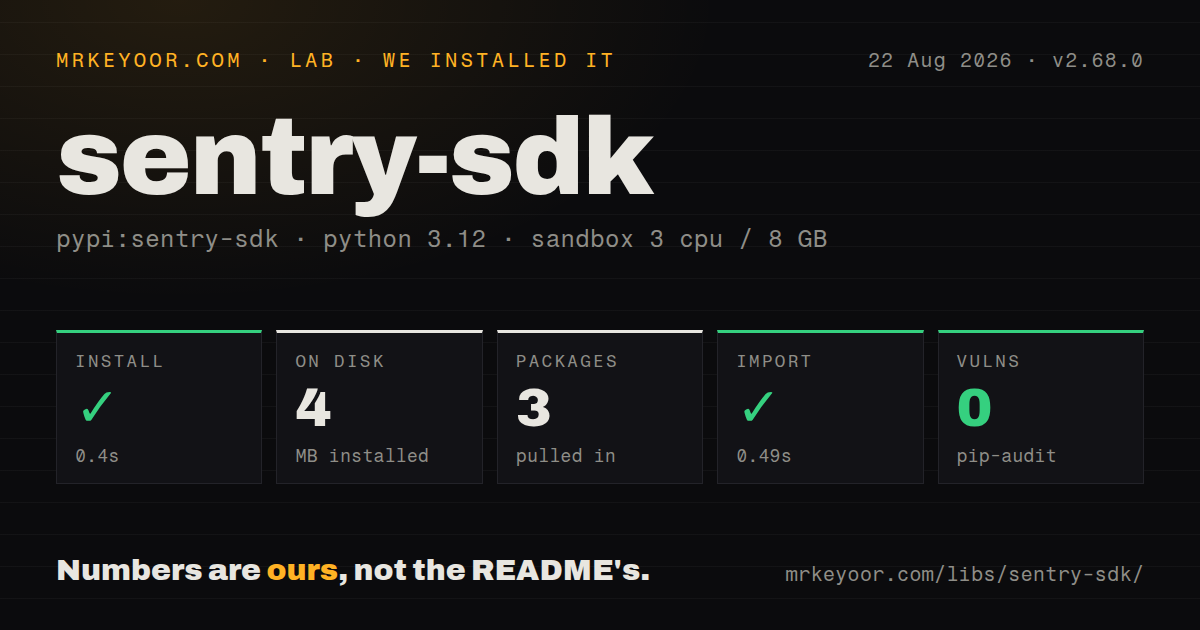
| Install | ✓ · 0.4s | 3 packages on disk · 4 MB |
| Import | ✓ | import sentry_sdk in 0.49s · pure Python · py.typed · requires Python >=3.6 |
| Known vulns | 0 | (pip-audit) |
Answers from our run
Does sentry-sdk install cleanly?
Yes. In a fresh container with an empty cache, pip install sentry-sdk finished in 0.4s, leaving 3 packages and 4 MB on disk. pip-audit reported no known vulnerabilities.
What does sentry-sdk need to run?
Python >=3.6, and nothing compiled: it is pure Python. In our run import sentry_sdk succeeded in 0.49s, and the package ships py.typed for type checkers.
sentry-sdk or opentelemetry-sdk: which should you use?
opentelemetry-sdk: Use it for vendor-neutral instrumentation exported through an OpenTelemetry pipeline. Sentry's SDK is a strong fit when the organization has chosen Sentry and wants framework-aware error context.
When should you not use sentry-sdk?
Plain structured logs already meet the operational need and no Sentry project or ingest budget exists
Use it if
- Unhandled Python exceptions should arrive with stack, request, release, environment, and framework context
- Django, Flask, FastAPI, Celery, or another supported integration should instrument failures and spans automatically
- Backend traces must connect with Sentry SDKs used by browser, mobile, or other services
- Short-lived jobs need explicit error capture, cron check-ins, or release-aware monitoring in the same Sentry project
- Plain structured logs already meet the operational need and no Sentry project or ingest budget exists
- Telemetry must stay vendor-neutral through an OpenTelemetry collector and backend-independent exporters
- The team cannot review and scrub request bodies, headers, locals, user data, and integration-specific attributes before production
- Frequent 2.x tracing, logging, metrics, and integration behavior changes are too costly for the upgrade policy
- Automatic patching of importable frameworks is unacceptable and every instrumentation hook must be selected manually
Setup reality
Our clean install of sentry-sdk 2.68.0 completed in 0.4 seconds. Three packages occupied 4 MB, and pip-audit reported no known vulnerabilities. The package declares 55 direct dependencies, requires Python 3.6 or newer, is pure Python, and ships py.typed. import sentry_sdk worked in 0.49 seconds. The measured metadata did not state a license; the repository identifies it as MIT.
Useful setup requires a Sentry project DSN. Initialize early in each worker process and set environment and release values that match deployment records. Review send_default_pii, request-body collection, stack locals, headers, and every enabled integration. before_send and related hooks are the last process-side chance to remove sensitive fields or drop events before transport.
Version 2.68.0 makes enable_logs and enable_metrics do nothing. Direct sentry_sdk.logger and metrics calls now send regardless of those flags. Automatic stdlib logging or Loguru capture is off unless the relevant integration receives capture_sentry_logs=True. An upgrade can therefore silence auto-collected logs or start sending direct API calls that an old false flag appeared to disable. Audit both cases before rollout.
Events leave through background transport. Scripts, serverless handlers, and short jobs should flush with a bounded timeout before exit. Sampling is separate for errors, traces, and profiles, and full tracing can create cost and latency that a basic error setup did not have. In prefork servers, initialize where the child owns its transport resources. Scope data must also be cleared between manual worker-loop jobs when no framework integration creates an isolation scope.
Patterns
Initialize with deployment identity initialize-sdk
import os
import sentry_sdk

sentry_sdk.init(
    dsn=os.environ['SENTRY_DSN'],
    environment=os.environ.get('APP_ENV', 'development'),
    release=os.environ.get('GIT_SHA'),
    send_default_pii=False,
    traces_sample_rate=0.05,
)
Initialize inside child workers for prefork servers. Choose a trace rate from traffic and budget rather than copying 1.0 from a quickstart.
Report a handled exception capture-exception
try:
    charge(order)
except PaymentError as error:
    event_id = sentry_sdk.capture_exception(error)
    logger.warning('payment failed', extra={'sentry_event_id': event_id})
    raise
capture_exception returns an event identifier that can connect application logs or support reports to Sentry.
Send an explicit operational message capture-message
event_id = sentry_sdk.capture_message(
    'inventory import skipped rows',
    level='warning',
)
Messages consume event volume and can create noisy issues. Prefer logs or metrics for high-frequency status data.
Attach user and domain context set-request-context
sentry_sdk.set_user({'id': str(user.id)})
sentry_sdk.set_tag('tenant', tenant.slug)
sentry_sdk.set_context('order', {
    'id': order.id,
    'total_cents': order.total_cents,
})
Avoid email, names, tokens, and payment data unless the approved data policy explicitly allows them.
Keep worker-job data from leaking isolate-job-scope
with sentry_sdk.isolation_scope() as scope:
    scope.set_tag('queue', queue_name)
    scope.set_tag('job_id', job.id)
    process(job)
Framework integrations often isolate requests automatically. Plain consumer loops need an explicit scope per message.
Record the step before a failure add-breadcrumb
sentry_sdk.add_breadcrumb(
    category='import',
    message='batch downloaded',
    level='info',
    data={'batch_id': batch_id, 'rows': row_count},
)
Breadcrumb buffers are capped. Avoid adding one per row in a large loop because useful earlier steps will be evicted.
Choose trace sampling by request sample-traces
def traces_sampler(context):
    path = context.get('asgi_scope', {}).get('path', '')
    if path in {'/health', '/metrics'}:
        return 0.0
    if path.startswith('/checkout'):
        return 0.5
    return 0.02

sentry_sdk.init(dsn=dsn, traces_sampler=traces_sampler)
traces_sampler takes precedence over traces_sample_rate. Preserve upstream sampling decisions when distributed traces require continuity.
Measure a custom operation create-span
with sentry_sdk.start_span(op='invoice.render', name='render invoice') as span:
    span.set_data('page_count', len(pages))
    render_pdf(pages)
A span needs an active sampled trace to be sent. Do not attach sensitive document contents as span data.
Remove sensitive headers before sending scrub-event
def before_send(event, hint):
    headers = event.get('request', {}).get('headers', {})
    for name in ('Authorization', 'Cookie', 'X-Api-Key'):
        if name in headers:
            headers[name] = '[filtered]'
    return event

sentry_sdk.init(dsn=dsn, before_send=before_send)
Returning None drops an event. Keep the hook defensive because an exception in scrubbing can lose the original report.
Opt into automatic stdlib log collection capture-python-logs
from sentry_sdk.integrations.logging import LoggingIntegration

sentry_sdk.init(
    dsn=dsn,
    integrations=[LoggingIntegration(capture_sentry_logs=True)],
)
In 2.68.0, enable_logs no longer controls automatic collection. capture_sentry_logs defaults to false.
Send a direct structured log send-structured-log
from sentry_sdk import logger as sentry_logger

sentry_logger.info(
    'import completed for {tenant}',
    tenant=tenant.slug,
    attributes={'rows': row_count},
)
Direct logger calls work in 2.68.0 regardless of enable_logs. Remove or filter calls when logs should not leave the process.
Flush a short-lived job flush-on-exit
try:
    run_job()
except Exception:
    sentry_sdk.capture_exception()
    raise
finally:
    sentry_sdk.flush(timeout=2.0)
A bounded flush gives the background transport time to send while preventing shutdown from waiting forever.
Alternatives
| Package | Registry | Pick it when |
|---|---|---|
| opentelemetry-sdk | PyPI | Use it for vendor-neutral instrumentation exported through an OpenTelemetry pipeline |
| rollbar | PyPI | Use it when hosted error tracking is needed without Sentry's broader tracing surface |
| elastic-apm | PyPI | Use it when traces, errors, and transactions already belong in an Elastic observability stack |
More infra guides
boto3 · opentelemetry-api · psutil · distro · @opentelemetry/api · google-cloud-storage · the whole shelf →
How this guide is made: grounded in the library's documentation, release notes, changelog, and issue history, on a fixed rubric — not a hands-on install of every release. The 50 most-downloaded entries are additionally install-verified in clean containers. Corrections: contact the desk.