ddtrace review
ddtrace is Datadog's in-process Python client for automatic framework tracing, custom spans, continuous profiling, log correlation, test visibility, and several security and AI products. It patches supported libraries early in process startup and sends telemetry either to a Datadog Agent or to an allowed agentless endpoint. Version 4.14.0 adds HTTP OTLP trace export, removable span tags and metrics, extra Data Streams checkpoint tags, and agentless OpenFeature delivery. Our lab ran 4.13.1, whose import took 1.26 seconds and loaded compiled extensions, so this is operational instrumentation rather than a lightweight logging helper.
ddtrace 4.13.1 installed as 6 packages and 30 MB in 0.8 seconds on our box, with a 1.26-second import and no audit findings. Adopt current 4.14.0 for a Datadog-owned telemetry stack; choose OpenTelemetry when backend independence outweighs Datadog's integrated products.
We installed it
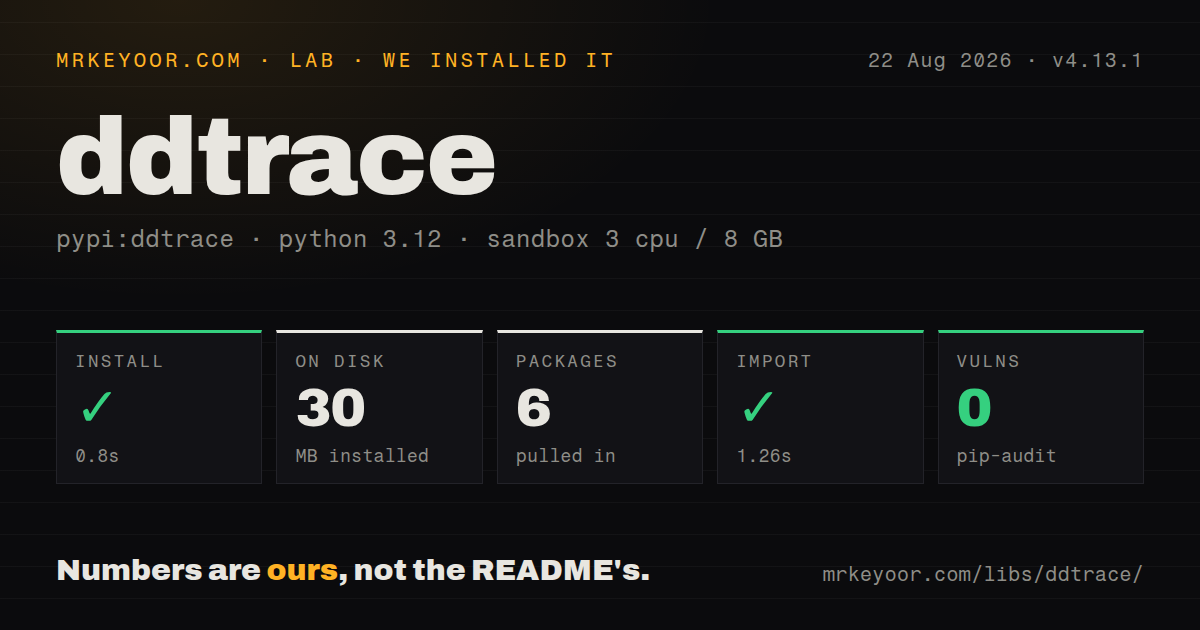
| Install | ✓ · 0.8s | 6 packages on disk · 30 MB |
| Import | ✓ | import ddtrace in 1.26s · compiled extensions · py.typed · requires Python <3.15,>=3.9 |
| Known vulns | 0 | (pip-audit) |
Answers from our run
Does ddtrace install cleanly?
Yes. In a fresh container with an empty cache, pip install ddtrace finished in 0.8s, leaving 6 packages and 30 MB on disk. pip-audit reported no known vulnerabilities.
What does ddtrace need to run?
Python <3.15,>=3.9, and a platform wheel with compiled extensions. In our run import ddtrace succeeded in 1.26s, and the package ships py.typed for type checkers.
ddtrace or opentelemetry-distro: which should you use?
Pick opentelemetry-distro when instrumentation and context propagation must remain portable across observability vendors. ddtrace 4.13.1 installed as 6 packages and 30 MB in 0.8 seconds on our box, with a 1.26-second import and no audit findings.
When should you not use ddtrace?
Telemetry must switch backends without rewriting vendor configuration. OpenTelemetry has a neutral API and exporter model, while ddtrace exposes Datadog products and environment variables throughout.
Use it if
- The service already reports to Datadog and you want framework, database, HTTP, queue, and custom spans under the same service identity.
- Automatic patching must begin before application imports, and you control the process command or entrypoint.
- Trace and profile correlation, Test Optimization, or Datadog LLM Observability is part of the deployment plan.
- Your team can canary instrumentation upgrades against the actual web server, worker model, and integration versions.
- Telemetry must switch backends without rewriting vendor configuration. OpenTelemetry has a neutral API and exporter model, while ddtrace exposes Datadog products and environment variables throughout.
- You only want error capture. sentry-sdk has a narrower purpose and avoids the Agent, profiler, and broad import-patching surface.
- Native wheels are not allowed in the runtime. The tested distribution ships .so files, so unsupported platforms can fall back to a build or fail installation.
- A small function cannot absorb the 30 MB and 6-package footprint from our 4.13.1 install, plus its 11 declared direct dependencies.
- Startup patching is prohibited. ddtrace-run and ddtrace.auto instrument supported modules by loading hooks before those modules are imported.
Setup reality
We installed ddtrace 4.13.1, the measured version, in an unprivileged Python 3.12 Bookworm container. The install completed in 0.8 seconds, left 6 packages, and consumed 30 MB. It declares 11 direct dependencies, supports Python 3.9 through 3.14, includes compiled .so extensions and py.typed, and imported in 1.26 seconds. pip-audit found zero known vulnerabilities. PyPI now lists 4.14.0, so the release features described here are one version newer than that sandbox run.
Instrumentation has to load before the framework and clients it patches. Start the command through ddtrace-run or put import ddtrace.auto first in the entrypoint; do not use both. Define DD_SERVICE, DD_ENV, and DD_VERSION so deploys do not inherit vague names. The normal trace path needs a reachable Datadog Agent. Agentless features require credentials, and the new 4.14.0 OpenFeature agentless default specifically needs DD_API_KEY.
Process topology matters. Prefork servers, gevent workers, uWSGI shutdown, and short jobs each have separate lifecycle concerns in the docs and release fixes. A call to patch() must precede the corresponding library import. Turning DD_TRACE_ENABLED off stops export but does not undo modules already patched in memory. Short commands should shut down or flush the tracer before exit; persistent services rely on their normal process shutdown.
Sampling rules stop at the first match, so place endpoint exceptions before a broad service rule. Standard logging can receive correlation IDs automatically. Custom JSON or structlog output needs fields from tracer.get_log_correlation_context(). Version 4.14.0 can export traces with OTLP over http/protobuf or http/json, but Datadog-specific integrations and product settings remain part of the package even when that export path is chosen.
Patterns
Launch a traced web process start-auto-instrumentation
export DD_SERVICE=checkout-api
export DD_ENV=production
export DD_VERSION=2026.08.26
export DD_TRACE_AGENT_URL=http://datadog-agent:8126

ddtrace-run gunicorn -w 4 'app:create_app()'
ddtrace-run installs import hooks before Gunicorn loads the application. Set the three identity tags explicitly for useful deployment comparisons.
Patch from application code instrument-fixed-entrypoint
import ddtrace.auto

from fastapi import FastAPI
import httpx

app = FastAPI()
ddtrace.auto must be the first application import. Use it when the launch command cannot be wrapped, and do not combine it with ddtrace-run.
Time one application operation create-custom-span
from ddtrace.trace import tracer

def price_order(order):
    with tracer.trace('pricing.calculate', service='checkout-api') as span:
        span.set_tag('order.currency', order.currency)
        span.set_metric('order.items', len(order.items))
        return sum(item.total for item in order.items)
Use tags for text dimensions and metrics for numeric values. Current code imports tracer from ddtrace.trace.
Wrap a sync or async function trace-decorated-function
from ddtrace.trace import tracer

@tracer.wrap('report.render', service='reporting', resource='monthly_pdf')
def render_monthly_pdf(account_id: str) -> bytes:
    ...

@tracer.wrap('cache.refresh')
async def refresh_cache() -> None:
    ...
tracer.wrap supports coroutine functions. Choose an operation name that groups comparable work instead of embedding account IDs in it.
Delete sensitive span fields remove-span-data
from ddtrace.trace import tracer

with tracer.trace('checkout.validate') as span:
    span.set_tag('customer.email', email)
    validate(order)
    span.remove_tag('customer.email')
    span.remove_metric('temporary.score')
remove_tag and remove_metric were added in 4.14.0. Both calls do nothing when the named field is absent.
Enable only named integrations patch-selected-clients
import ddtrace

ddtrace.patch(
    django=True,
    psycopg=True,
    redis=True,
    requests=False,
    logging=True,
)
Call patch before importing Django, psycopg, Redis, or any other selected target. Later calls cannot retroactively wrap already imported objects reliably.
Put trace IDs into custom records add-log-correlation
from ddtrace.trace import tracer

def trace_fields() -> dict[str, str]:
    context = tracer.get_log_correlation_context()
    return {
        'dd.trace_id': context.get('trace_id', '0'),
        'dd.span_id': context.get('span_id', '0'),
    }
Custom JSON and structlog pipelines need these fields added to each event. DD_LOGS_INJECTION mainly targets supported standard logging paths.
Put specific sampling rules first configure-sampling-order
export DD_TRACE_SAMPLING_RULES='[
  {"service":"checkout-api","resource":"GET /healthz","sample_rate":0.0},
  {"service":"checkout-api","sample_rate":1.0},
  {"sample_rate":0.1}
]'
The first matching rule decides the rate. A service-wide entry placed first would prevent the health endpoint exception from running.
Send traces to an OTLP HTTP endpoint export-traces-over-otlp
export OTEL_EXPORTER_OTLP_TRACES_PROTOCOL=http/protobuf
export OTEL_EXPORTER_OTLP_TRACES_ENDPOINT=https://collector.example.com/v1/traces
export OTEL_EXPORTER_OTLP_HEADERS='authorization=Bearer%20TOKEN'
Version 4.14.0 supports http/protobuf and http/json for OTLP trace export. Keep the endpoint token in a secret store rather than a checked-in shell file.
Carry trace context through a custom queue propagate-unsupported-queue
from ddtrace.propagation.http import HTTPPropagator
from ddtrace.trace import tracer

headers: dict[str, str] = {}
span = tracer.current_span()
if span is not None:
    HTTPPropagator.inject(span.context, headers)
queue.publish(payload, headers=headers)
current_span() returns None outside active work. The consumer must extract and activate the received context before opening its processing span.
Start profiling with automatic tracing enable-continuous-profiler
export DD_PROFILING_ENABLED=true
export DD_PROFILING_TIMELINE_ENABLED=true

ddtrace-run python -m checkout
The profiler samples inside each application process. Test memory, CPU, gevent, and worker shutdown behavior on a canary before enabling every instance.
Stop telemetry delivery in tests disable-test-export
export DD_TRACE_ENABLED=false
export DD_PROFILING_ENABLED=false
export DD_INSTRUMENTATION_TELEMETRY_ENABLED=false
DD_TRACE_ENABLED=false stops sending traces. It does not reverse import hooks or wrappers that ddtrace-run or ddtrace.auto already installed.
Alternatives
| Package | Registry | Pick it when |
|---|---|---|
| opentelemetry-distro | PyPI | Pick it when instrumentation and context propagation must remain portable across observability vendors. |
| sentry-sdk | PyPI | Pick it when exception capture and transaction timing are enough, without a full Datadog Agent workflow. |
| elastic-apm | PyPI | Pick it when Elastic already stores the traces, errors, and service maps. |
| pyroscope-io | PyPI | Pick it when continuous profiling is the main requirement and application tracing lives elsewhere. |
More infra guides
boto3 · opentelemetry-api · psutil · distro · @opentelemetry/api · google-cloud-storage · the whole shelf →
How this guide is made: grounded in the library's documentation, release notes, changelog, and issue history, on a fixed rubric — not a hands-on install of every release. The 50 most-downloaded entries are additionally install-verified in clean containers. Corrections: contact the desk.