d3 review
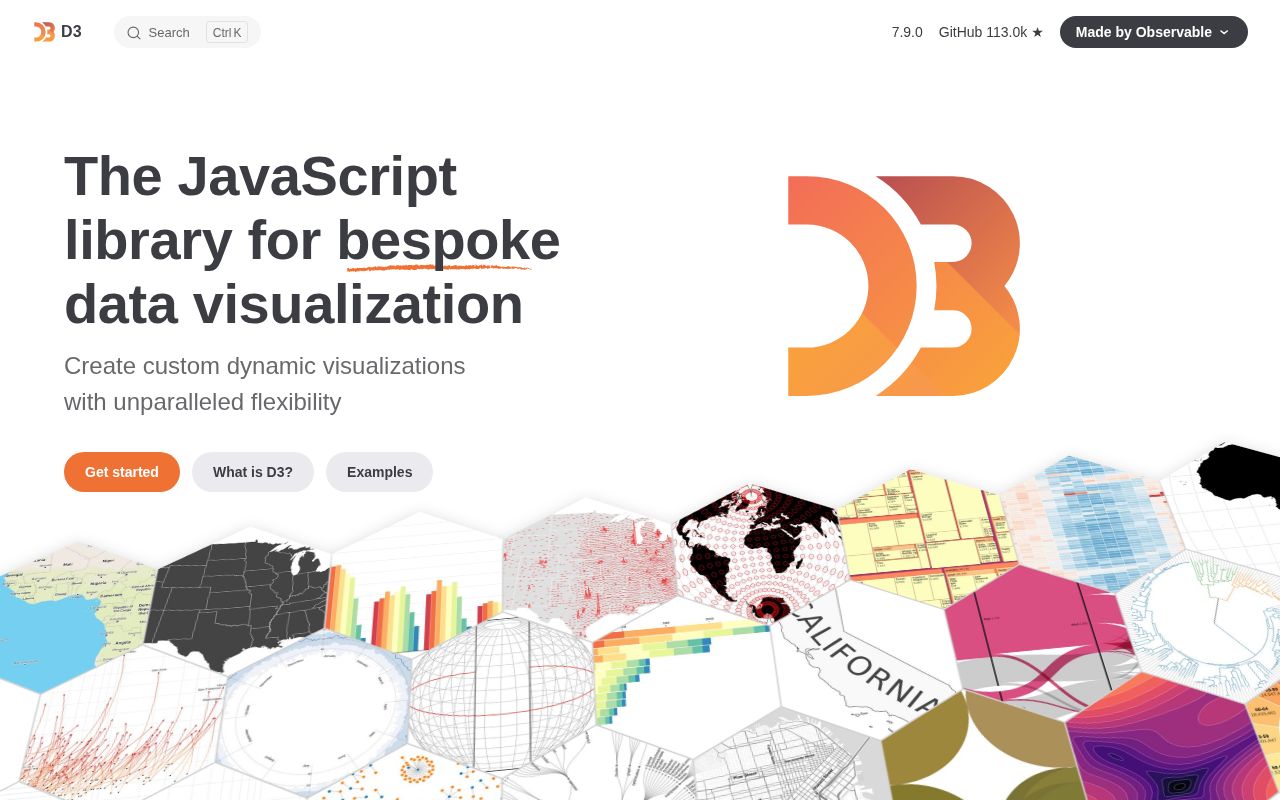
D3 is a set of JavaScript building blocks for data graphics, not a menu of finished chart components. It supplies scales, array transforms, SVG shape generators, selections, transitions, geographic projections, zoom and drag behavior, hierarchies, and force simulation. You decide how those pieces map data into DOM, SVG, canvas, or another renderer. Version 7.9.0 adds the Observable10 categorical color scheme and changes geographic circle and clip-angle precision to two degrees. Our all-in browser import measured 92.7 KB gzipped, which is why many applications import individual d3-* modules instead of the umbrella package.
D3 is worth its learning cost when the graphic itself requires custom geometry, layout, or interaction. For familiar dashboard charts, the measured full bundle and the amount of UI work make a higher-level library the better starting point.
We installed it
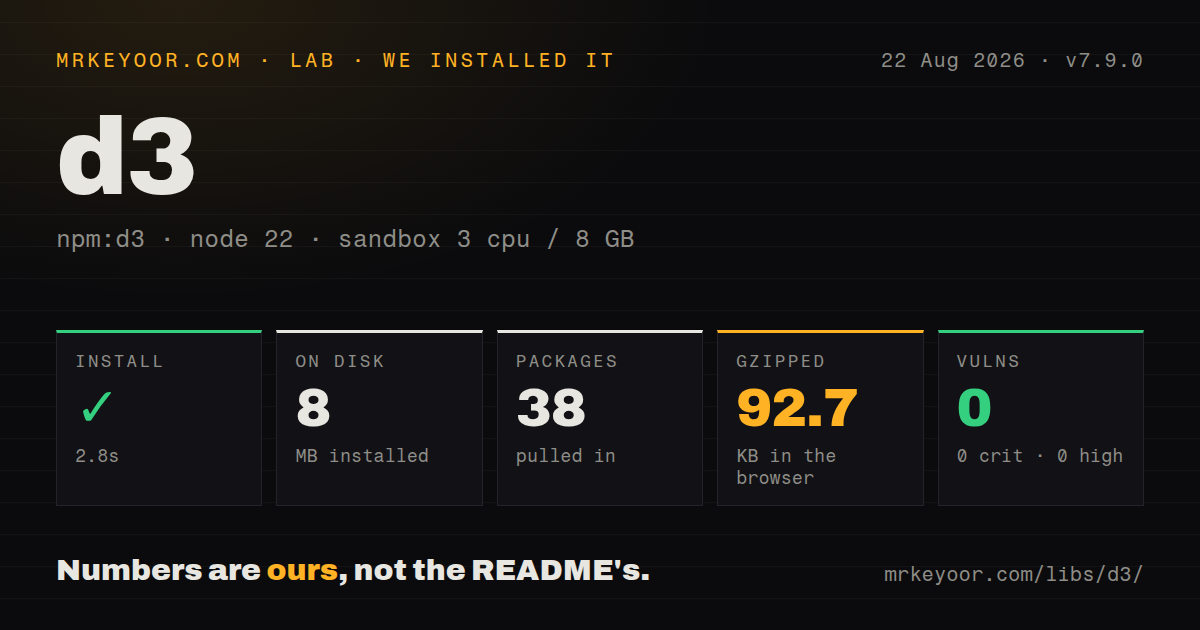
| Install | ✓ · 2.8s | 38 packages on disk · 8 MB |
| Import | ✓ | ESM import works · require() works · ESM package with exports map |
| Browser | 92.7 KB | gzipped (277.1 KB minified), bundled with esbuild |
| Types | — | no TypeScript types found |
| Known vulns | 0 | 0 critical · 0 high · 0 moderate · 0 low (npm audit) |
Answers from our run
Does d3 install cleanly?
Yes. In a fresh container with an empty cache, npm install d3 finished in 3 seconds, leaving 38 packages and 8 MB on disk. npm audit reported no known vulnerabilities.
How much does d3 add to a browser bundle?
92.7 KB gzipped (277.1 KB minified) when the whole package is bundled for the browser with esbuild. Importing only part of it is usually smaller.
Does d3 work with both ESM and CommonJS?
Yes. Both import 'd3' and require('d3') worked in Node 22 in our run. The package is published as ESM with an exports map.
Does d3 include TypeScript types?
No type declarations were found in our install, so TypeScript users need their own declarations.
d3 or chart.js: which should you use?
chart.js: Use it for common responsive canvas charts with a configuration API and built-in plugins. D3 is worth its learning cost when the graphic itself requires custom geometry, layout, or interaction.
When should you not use d3?
The requirement is a standard dashboard chart with legends and tooltips; Chart.js or ECharts supplies those parts with much less code
Use it if
- The visualization has a bespoke layout or interaction that a chart configuration API cannot express
- You need D3's force, hierarchy, geographic, contour, scale, or shape algorithms while keeping control of rendering
- An editorial graphic needs direct SVG or canvas control, custom transitions, brushing, dragging, and zoom behavior
- You can install individual d3-* packages when only arrays, scales, formatting, or shapes are required
- The requirement is a standard dashboard chart with legends and tooltips; Chart.js or ECharts supplies those parts with much less code
- React, Vue, or Svelte must own every rendered node; D3 selections mutate the DOM and require a carefully chosen boundary with framework rendering
- A 92.7 KB gzipped full import does not fit the page budget; importing the umbrella namespace made esbuild include the complete suite in our test
- Your TypeScript policy requires declarations in every production package; the d3 distribution contained no bundled types in our inspection
- Your team expects current tutorials to copy unchanged; many search results still use the removed d3.event global or the older enter/merge pattern
Setup reality
Our fresh Node 22 install of d3 7.9.0 completed in 2.8 seconds. It left 38 packages using 8 MB, and npm audit found no known vulnerabilities at any severity. The package declares 30 direct dependencies, no peers, an ISC license, and Node >=12. Its own unpacked size is 880 KB. D3 is marked as ESM and has an exports map; both require() and ESM import worked in our sandbox. No TypeScript declarations were bundled.
The largest first-run surprise is browser cost. Importing the entire package with esbuild produced 277.1 KB minified and 92.7 KB gzipped. Install and import a specific module such as d3-scale or d3-array when that is all the feature needs. Bundlephobia currently reports 89.8 KB gzipped for its build, close enough to confirm that an umbrella import belongs in the performance budget rather than being treated as a tiny helper.
D3 has no credentials or config file. The configuration lives in code: domains, ranges, accessors, render containers, and event handlers. CSV columns remain strings unless a row converter or d3.autoType is supplied. SVG y coordinates increase downward, scaleBand positions can be undefined for values outside the domain, and ordinal scales assign colors in encounter order unless you provide a fixed domain. These are common data bugs, not setup errors.
Selections directly change DOM nodes. In React or another virtual-DOM framework, let the framework render nodes and use D3 for calculations, or give D3 ownership of an isolated ref subtree. Force simulations mutate node and link objects and continue scheduling ticks until they cool or are stopped. Transition handlers also schedule work and can be interrupted by a newer transition. Cleanup on component unmount is part of the integration, especially for simulations, zoom listeners, and long-running transitions.
Patterns
Create and update circles with join join-data-to-elements
import * as d3 from "d3";

d3.select("#chart")
  .selectAll("circle")
  .data(points, (d) => d.id)
  .join("circle")
  .attr("cx", (d) => d.x)
  .attr("cy", (d) => d.y)
  .attr("r", 4);
A stable key keeps nodes attached to the same records. join() covers enter, update, and exit for this simple case.
Map values and render two axes draw-linear-axes
const x = d3.scaleLinear().domain([0, 100]).range([40, 620]);
const y = d3.scaleLinear().domain([0, d3.max(data, d => d.value)]).range([360, 20]);

svg.append("g").attr("transform", "translate(0,360)").call(d3.axisBottom(x));
svg.append("g").attr("transform", "translate(40,0)").call(d3.axisLeft(y));
The y output range is reversed because zero pixels is the top of SVG.
Generate an SVG line path render-line-series
const line = d3.line()
  .defined(d => d.value != null)
  .x(d => x(d.date))
  .y(d => y(d.value));

svg.append("path").datum(data)
  .attr("fill", "none")
  .attr("stroke", "steelblue")
  .attr("d", line);
datum() binds the whole series to one path. defined() breaks the line around missing values.
Position bars with a band scale render-band-bars
const x = d3.scaleBand().domain(data.map(d => d.name)).range([40, 620]).padding(0.12);

svg.selectAll("rect").data(data).join("rect")
  .attr("x", d => x(d.name))
  .attr("width", x.bandwidth())
  .attr("y", d => y(d.value))
  .attr("height", d => y(0) - y(d.value));
Calculate height through the y scale. Raw data values are not SVG pixel heights once the domain changes.
Convert CSV rows while loading load-typed-csv
const rows = await d3.csv("events.csv", row => ({
  date: d3.utcParse("%Y-%m-%d")(row.date),
  value: Number(row.value),
}));
d3.csv returns strings by default. A row converter makes numeric and date types explicit and can reject malformed rows.
Transition bars to new values animate-bars
bars.transition()
  .duration(500)
  .ease(d3.easeCubicOut)
  .attr("y", d => y(d.value))
  .attr("height", d => y(0) - y(d.value));
A later transition with the same name interrupts the active one on each element. Avoid using animation as the only signal of change.
Pan and zoom an isolated plot group add-svg-zoom
const zoom = d3.zoom().scaleExtent([1, 8]).on("zoom", event => {
  plot.attr("transform", event.transform);
});
svg.call(zoom);
Current handlers receive event as an argument. Code that reads d3.event targets an older major.
Lay out a force-directed network simulate-force-network
const simulation = d3.forceSimulation(nodes)
  .force("link", d3.forceLink(links).id(d => d.id))
  .force("charge", d3.forceManyBody().strength(-160))
  .force("center", d3.forceCenter(width / 2, height / 2))
  .on("tick", renderTick);
The simulation adds position and velocity fields to node objects. Stop it during component cleanup or when the view is removed.
Format a UTC time axis build-time-axis
const x = d3.scaleUtc()
  .domain(d3.extent(data, d => d.date))
  .range([40, 620]);

axis.call(d3.axisBottom(x).ticks(6).tickFormat(d3.utcFormat("%b %Y")));
Use Date objects in the domain. scaleUtc avoids local daylight-saving shifts when data is stored in UTC.
Fix a categorical color domain assign-stable-category-colors
const color = d3.scaleOrdinal()
  .domain(["new", "active", "closed"])
  .range(d3.schemeObservable10);
Version 7.9.0 adds schemeObservable10. Setting the domain prevents first-seen order from changing category colors between views.
Group rows and sum values aggregate-with-rollup
const totals = d3.rollup(
  rows,
  group => d3.sum(group, d => d.amount),
  d => d.category,
);
rollup returns an InternMap, not a plain object. Use totals.get(category) or convert entries when serializing.
Project GeoJSON into an SVG path draw-geo-path
const projection = d3.geoMercator().fitSize([width, height], featureCollection);
const path = d3.geoPath(projection);

svg.selectAll("path").data(featureCollection.features).join("path")
  .attr("d", path);
fitSize derives scale and translation from the supplied geometry. Mercator is unsuitable when equal area is the requirement.
Alternatives
| Package | Registry | Pick it when |
|---|---|---|
| chart.js | npm | Use it for common responsive canvas charts with a configuration API and built-in plugins |
| echarts | npm | Use it for interactive dashboards that need legends, tooltips, zooming, and many chart types out of the box |
| plotly.js-dist-min | npm | Use it for scientific and analytical charts where a large ready-made feature set matters more than bundle weight |
More data guides
numpy · fsspec · pandas · pyarrow · sqlalchemy · s3fs · the whole shelf →
How this guide is made: grounded in the library's documentation, release notes, changelog, and issue history, on a fixed rubric — not a hands-on install of every release. The 50 most-downloaded entries are additionally install-verified in clean containers. Corrections: contact the desk.