chart.js review
Chart.js 4.5.1 draws bar, line, doughnut, pie, radar, polar area, scatter, and bubble charts into an HTML canvas. It owns the scales, legend, tooltip, animation, resizing, and pointer hit testing, while your code supplies datasets and options. The convenient `chart.js/auto` entry registers every built-in part; named imports let a bundler discard controllers and plugins you never register. Our whole-package browser build measured 200.6 KB minified and 68.8 KB gzipped. Version 4.5.1 fixes plugin calls after uninstall, doughnut legend option handling, a Chrome zoom shrink bug, and three gaps in the TypeScript declarations.
Chart.js 4.5.1 installed in 1.2 seconds and its full browser import measured 68.8 KB gzipped in our sandbox, making it a practical choice for standard canvas charts if that payload fits. Do not install it for DOM-addressable marks, built-in specialist chart types, or a time axis with zero adapter setup.
We installed it
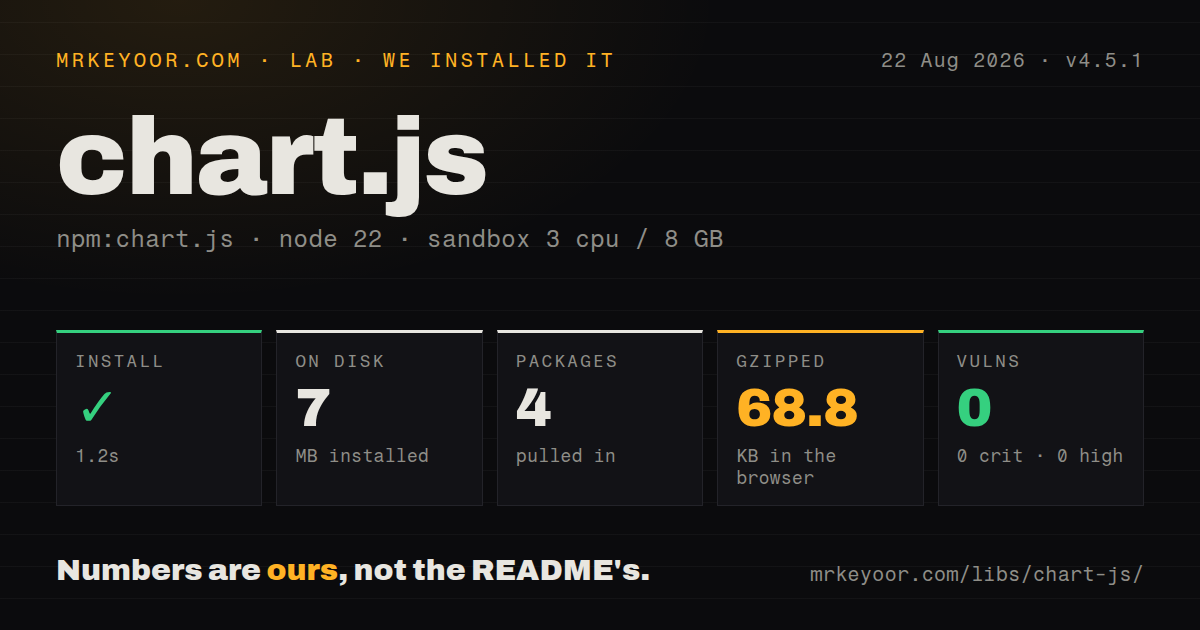
| Install | ✓ · 1.2s | 4 packages on disk · 7 MB |
| Import | ✓ | ESM import works · require() works · ESM package with exports map |
| Browser | 68.8 KB | gzipped (200.6 KB minified), bundled with esbuild |
| Types | ✓ | TypeScript types bundled |
| Known vulns | 0 | 0 critical · 0 high · 0 moderate · 0 low (npm audit) |
Answers from our run
Does chart.js install cleanly?
Yes. In a fresh container with an empty cache, npm install chart.js finished in 1 seconds, leaving 4 packages and 7 MB on disk. npm audit reported no known vulnerabilities.
How much does chart.js add to a browser bundle?
68.8 KB gzipped (200.6 KB minified) when the whole package is bundled for the browser with esbuild. Importing only part of it is usually smaller.
Does chart.js work with both ESM and CommonJS?
Yes. Both import 'chart.js' and require('chart.js') worked in Node 22 in our run. The package is published as ESM with an exports map.
Does chart.js include TypeScript types?
Yes, type declarations ship inside the package, so no @types install is needed.
chart.js or echarts: which should you use?
echarts: Use it when maps, Sankey diagrams, treemaps, candlesticks, and dashboard interactions need to come from one chart package. Chart.js 4.5.1 installed in 1.2 seconds and its full browser import measured 68.8 KB gzipped in our sandbox, making it a practical choice for standard canvas charts if that payload fits.
When should you not use chart.js?
Each plotted mark must be a focusable or selectable DOM node. Chart.js draws one canvas bitmap, so exact values need a separate accessible table or text representation.
Use it if
- You are building standard product charts and want canvas rendering, scales, hover tooltips, legends, and animation behind one configuration object.
- Your data updates after the chart is mounted and you need a documented update and destroy lifecycle instead of managing canvas drawing state yourself.
- You can register only the chart controllers, elements, scales, and plugins used by a page to reduce the browser payload.
- The same chart code must work through npm, CommonJS require, ESM import, or the published UMD build for a script tag.
- Each plotted mark must be a focusable or selectable DOM node. Chart.js draws one canvas bitmap, so exact values need a separate accessible table or text representation.
- Your product needs Sankey, Gantt, candlestick, treemap, funnel, or map charts from the core package. Chart.js delegates those shapes to extensions with separate maintainers.
- A 68.8 KB gzipped full import breaks the page budget and your team does not want to maintain an explicit component registration list.
- Dates must work without another dependency. The documented time scale has no date implementation and requires a compatible adapter such as the date-fns or Luxon adapter.
- Zoom, pan, annotation, and data-label behavior must ship and version with the renderer. The project documents those features as plugins rather than Chart.js core.
Setup reality
Our install of chart.js 4.5.1 completed in 1.2 seconds in a clean Node 22 container. Four packages occupied 7 MB afterward. Chart.js declares 1 direct dependency, no peer dependencies, and ships 6416 KB unpacked with its own TypeScript declarations. npm audit reported 0 known vulnerabilities. Both require() and ESM import worked. An esbuild import of the complete package came to 200.6 KB minified and 68.8 KB gzipped.
Choose the import path before writing chart code. chart.js/auto makes every standard type available immediately. With named imports, Chart.register() must include every controller, element, scale, and plugin referenced by the configuration. Omit one and construction fails at runtime. A time axis adds another requirement: install and load a date adapter before creating the chart. No credentials or project config file are involved.
Responsive sizing follows the canvas parent. Give that parent a resolved width and height, then disable maintainAspectRatio if the canvas should fill it. Mutating labels or datasets does nothing on screen until chart.update() runs. Before a framework remounts or reuses the same canvas, call destroy() so the old instance releases listeners and ownership. These lifecycle calls are easy to miss because the initial 4.5.1 render needs only a constructor.
A canvas does not expose individual values to screen readers. Put a useful label or description on it and publish the numbers as HTML when exact reading matters. For a large line series, sorted {x, y} points, parsing: false, zero-radius points, and the decimation plugin give Chart.js less work. Those switches assume a specific data shape, so test them with production-sized input rather than a 20-point sample.
Patterns
Render a bar chart with all built-ins registered render-bar-chart
import Chart from 'chart.js/auto';

const chart = new Chart(document.querySelector('#sales'), {
  type: 'bar',
  data: {
    labels: ['Jan', 'Feb', 'Mar'],
    datasets: [{ label: 'Units', data: [12, 19, 7] }],
  },
  options: { scales: { y: { beginAtZero: true } } },
});
The `auto` entry registers every standard controller, element, scale, and plugin before the 4.5.1 chart is constructed. That convenience keeps the whole built-in feature set available to the bundler.
Register only the parts used by a line chart register-line-parts
import {
  Chart, LineController, LineElement, PointElement,
  LinearScale, CategoryScale, Tooltip, Legend,
} from 'chart.js';

Chart.register(
  LineController, LineElement, PointElement,
  LinearScale, CategoryScale, Tooltip, Legend,
);
Chart.js checks the registration list when it constructs the chart. Leave out `LineController`, either scale, or a referenced plugin and the page gets a runtime error rather than a build error.
Replace a series and redraw it replace-data
chart.data.labels = ['Apr', 'May', 'Jun'];
chart.data.datasets[0].data = [9, 14, 11];
chart.update();

chart.data.datasets[0].data = nextValues;
chart.update('none');
Dataset mutation alone leaves the existing pixels in place. `update()` recalculates and draws; the `none` mode skips animation when frequent 4.5.1 updates would otherwise queue transitions.
Destroy the instance during framework cleanup destroy-on-unmount
useEffect(() => {
  const instance = new Chart(canvasRef.current, config);
  return () => instance.destroy();
}, []);
One canvas can belong to only one live Chart instance. `destroy()` removes its event listeners and releases the canvas before a development remount or route change creates another instance.
Size a responsive chart from its parent fill-container
<div class="chart-box"><canvas id="traffic"></canvas></div>
<style>
.chart-box { position: relative; width: 100%; height: 320px; }
</style>
<script type="module">
new Chart(document.querySelector('#traffic'), {
  type: 'line', data,
  options: { responsive: true, maintainAspectRatio: false },
});
</script>
Responsive mode reads the parent dimensions, so the 320px height belongs on the wrapper. Without a resolved parent height, disabling the aspect ratio can produce a collapsed or repeatedly growing canvas.
Load a date adapter before using a time axis use-time-scale
import 'chartjs-adapter-date-fns';
import Chart from 'chart.js/auto';

new Chart(canvas, {
  type: 'line',
  data: { datasets: [{ data: readings }] },
  options: { parsing: false, scales: { x: { type: 'time', time: { unit: 'day' } } } },
});
The `time` scale in Chart.js 4.5.1 does not parse dates by itself. Install a supported adapter and its date library, then load the adapter before the chart constructor runs.
Format a tooltip value as currency format-tooltip
const money = new Intl.NumberFormat('en-IN', {
  style: 'currency', currency: 'INR', maximumFractionDigits: 0,
});
const options = { plugins: { tooltip: { callbacks: {
  label: (ctx) => `${ctx.dataset.label}: ${money.format(ctx.parsed.y)}`,
} } } };
`ctx.parsed` contains the value after the scale has parsed it. Read `ctx.raw` instead when the original object has fields the tooltip needs, and keep callback settings under `options.plugins.tooltip`.
Place bars and a line on separate axes mix-line-and-bars
new Chart(canvas, {
  type: 'bar',
  data: { labels, datasets: [
    { label: 'Revenue', data: revenue, yAxisID: 'y' },
    { type: 'line', label: 'Margin %', data: margin, yAxisID: 'y1' },
  ] },
  options: { scales: {
    y: { position: 'left', beginAtZero: true },
    y1: { position: 'right', min: 0, max: 100, grid: { drawOnChartArea: false } },
  } },
});
A dataset can override the chart-level `type`. Named-import builds need the controllers, elements, and scales for both bar and line rendering registered before this 2-axis chart is created.
Stack datasets into named groups stack-datasets
const data = { labels, datasets: [
  { label: 'Web', data: web, stack: 'traffic' },
  { label: 'App', data: app, stack: 'traffic' },
  { label: 'Goal', data: goal, stack: 'target' },
] };
const options = {
  scales: { x: { stacked: true }, y: { stacked: true, beginAtZero: true } },
};
Both axes need `stacked: true` for a normal stacked bar chart. The 2 traffic datasets accumulate together because their stack IDs match, while `target` remains a separate group.
Decimate a dense line series before drawing decimate-line-data
new Chart(canvas, {
  type: 'line',
  data: { datasets: [{ data: sortedPoints, pointRadius: 0 }] },
  options: {
    parsing: false, normalized: true, animation: false,
    plugins: { decimation: { enabled: true, algorithm: 'lttb', samples: 500 } },
    scales: { x: { type: 'linear' } },
  },
});
Built-in decimation applies only to eligible line data on a linear or time index axis. Sorted `{x, y}` points and disabled parsing give the 4.5.1 renderer the input shape this optimization expects.
Paint a white background before PNG export export-png
const whiteBackground = {
  id: 'whiteBackground',
  beforeDraw(chart) {
    const { ctx, width, height } = chart;
    ctx.save();
    ctx.globalCompositeOperation = 'destination-over';
    ctx.fillStyle = '#fff';
    ctx.fillRect(0, 0, width, height);
    ctx.restore();
  },
};
const chart = new Chart(canvas, { ...config, plugins: [whiteBackground] });
const png = chart.toBase64Image();
Canvas pixels remain transparent unless a plugin or CSS paints a background. This plugin draws behind the chart before `toBase64Image()` captures the 4.5.1 canvas.
Read the data point under a click handle-click
const options = {
  onClick(event, elements, chart) {
    if (elements.length === 0) return;
    const { datasetIndex, index } = elements[0];
    const label = chart.data.labels[index];
    const value = chart.data.datasets[datasetIndex].data[index];
    console.log({ label, value });
  },
};
Clicks outside a plotted element produce an empty array. Check its length before using the dataset and point indexes, or empty plot space will trigger an undefined-property error.
Alternatives
| Package | Registry | Pick it when |
|---|---|---|
| echarts | npm | Use it when maps, Sankey diagrams, treemaps, candlesticks, and dashboard interactions need to come from one chart package. |
| plotly.js | npm | Use it for scientific and 3D plots where an included interaction toolbar matters more than download size. |
| uplot | npm | Use it for dense time series when a narrow API and smaller browser cost beat the wider Chart.js chart catalog. |
More web frontend guides
postcss · react · react-dom · tailwindcss · htmlparser2 · tailwind-merge · the whole shelf →
How this guide is made: grounded in the library's documentation, release notes, changelog, and issue history, on a fixed rubric — not a hands-on install of every release. The 50 most-downloaded entries are additionally install-verified in clean containers. Corrections: contact the desk.