echarts review
ECharts 6.1 turns a JavaScript option object into interactive Canvas or SVG charts, covering ordinary lines and bars as well as graphs, maps, Sankey diagrams, heatmaps, calendars, and custom series. It owns rendering, axes, legends, tooltips, zooming, selection, animation, and export rather than supplying React components. Version 6.1 adds `dataMin` and `dataMax` axis extents, more axis and matrix events, clockwise radar charts, and automatic handling of non-positive values on logarithmic axes. Our full-package browser build reached 1,114.8 KB minified, so its breadth has a measurable download cost unless you register only the pieces a page uses.
ECharts 6.1.0 installed in 1.9 seconds with no audit findings, but our full import produced 1,114.8 KB minified and 373.6 KB gzipped. Install it for dashboards that will use its chart range and interaction system, then register selective modules; a couple of simple charts do not justify the full build.
We installed it
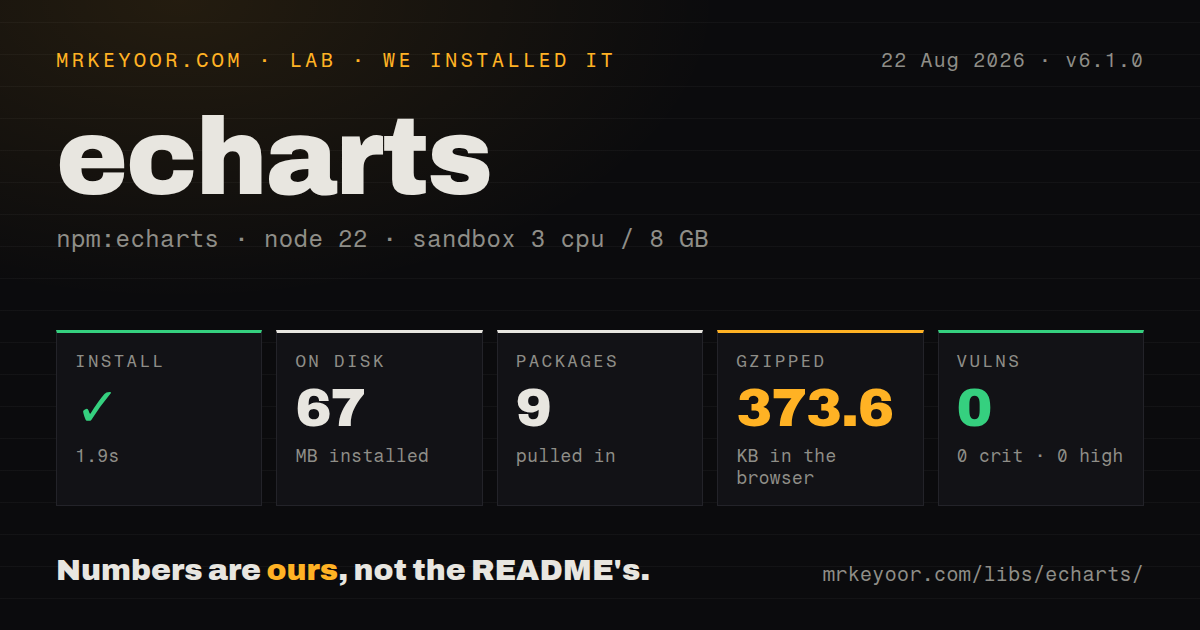
| Install | ✓ · 1.9s | 9 packages on disk · 67 MB |
| Import | ✓ | ESM import works · require() works · ESM package with exports map |
| Browser | 373.6 KB | gzipped (1114.8 KB minified), bundled with esbuild |
| Types | ✓ | TypeScript types bundled |
| Known vulns | 0 | 0 critical · 0 high · 0 moderate · 0 low (npm audit) |
Answers from our run
Does echarts install cleanly?
Yes. In a fresh container with an empty cache, npm install echarts finished in 2 seconds, leaving 9 packages and 67 MB on disk. npm audit reported no known vulnerabilities.
How much does echarts add to a browser bundle?
373.6 KB gzipped (1114.8 KB minified) when the whole package is bundled for the browser with esbuild. Importing only part of it is usually smaller.
Does echarts work with both ESM and CommonJS?
Yes. Both import 'echarts' and require('echarts') worked in Node 22 in our run. The package is published as ESM with an exports map.
Does echarts include TypeScript types?
Yes, type declarations ship inside the package, so no @types install is needed.
echarts or chart.js: which should you use?
chart.js: Choose Chart.js for familiar dashboard charts when its smaller set of chart types and plugin model covers the job. ECharts 6.1.0 installed in 1.9 seconds with no audit findings, but our full import produced 1,114.8 KB minified and 373.6 KB gzipped.
When should you not use echarts?
You only need a small sparkline or two: our namespace import produced a 373.6 KB gzipped browser bundle, while uPlot or a small SVG component leaves less JavaScript on the page
Use it if
- You need several chart families, linked interactions, zoom controls, or visual maps under one option-driven API
- Your dashboard can register selected charts and components from `echarts/core` instead of shipping the full package
- You need Canvas for dense marks but want SVG rendering available for a different page or export workflow
- You can own container sizing, lifecycle cleanup, and accessible text around a chart
- You only need a small sparkline or two: our namespace import produced a 373.6 KB gzipped browser bundle, while uPlot or a small SVG component leaves less JavaScript on the page
- You want native React composition: ECharts mutates an instance attached to a DOM node, and the official package does not provide React components or hook lifecycle management
- Your charts must work without JavaScript or expose every mark as ordinary DOM content: Canvas is the default renderer, and even SVG output still needs a text or table alternative for many users
- You are upgrading a screenshot-tested ECharts 5 dashboard without review: version 6 changed the default theme, legend placement, axis overflow layout, percent bases, and rich-label inheritance
- You need WebGL charts from the base install: the README lists ECharts GL as a separate extension, so globe and 3D work adds another package and compatibility surface
Setup reality
Our ECharts 6.1.0 install finished in 1.9 seconds and left 9 packages using 67 MB on disk. The package itself was 62,924 KB unpacked, with 2 direct dependencies, no peer dependencies, bundled TypeScript declarations, and no findings in npm audit. Both require() and ESM import worked on Node 22.
A full import * browser build cost 1,114.8 KB minified and 373.6 KB gzipped in our sandbox. For a smaller client build, import echarts/core, then register the exact chart types, components, features, and either CanvasRenderer or SVGRenderer with use(). Forgetting one registration usually gives a missing chart or component at runtime, not an install error.
ECharts needs a DOM element with a real width and height before init(). Call resize() when its container changes, and call dispose() when a route or component unmounts. Repeatedly initializing the same node without disposal leaves listeners and chart state behind. No credentials or config file are required unless a chosen map or data source needs them.
Version 6.1.0 changes three behaviors relative to 6.0: tooltip.valueFormatter receives the raw data index, axis.startValue no longer doubles as axis.min, and edge bars or candlesticks are contained by default. It also removes non-positive values from log-axis calculations. Treat those as visual regression targets, especially when upgrading charts with dataZoom, custom tooltip logic, or fixed screenshots.
Patterns
Render a line chart with the full entry point render-basic-line-chart
import * as echarts from 'echarts';

const element = document.querySelector('#chart');
const chart = echarts.init(element);

chart.setOption({
  xAxis: { type: 'category', data: ['Mon', 'Tue', 'Wed'] },
  yAxis: { type: 'value' },
  series: [{ type: 'line', data: [12, 18, 15] }],
});
The container needs an explicit height before `init()` runs; otherwise the instance can initialize against a zero-height box.
Register only the modules a bar chart uses build-selective-bundle
import * as echarts from 'echarts/core';
import { BarChart } from 'echarts/charts';
import { GridComponent, TooltipComponent } from 'echarts/components';
import { CanvasRenderer } from 'echarts/renderers';

echarts.use([BarChart, GridComponent, TooltipComponent, CanvasRenderer]);
Our full import was 373.6 KB gzipped. Selective imports help only when every required chart, component, feature, and renderer comes from the tree-shakable entry points.
Resize with the chart container resize-responsive-chart
const observer = new ResizeObserver(() => chart.resize());
observer.observe(element);

// during teardown
observer.disconnect();
chart.dispose();
A window resize listener misses flex, grid, sidebar, and tab changes that alter the container without changing the viewport.
Update a running chart replace-and-append-data
chart.setOption({
  series: [{ id: 'requests', data: nextPoints }],
});

chart.appendData({
  seriesIndex: 0,
  data: incomingPoints,
});
`setOption` merges by default. Use stable series IDs, and reserve `appendData` for supported large-data series where old points do not need replacement.
Handle clicks on plotted data handle-point-click
chart.on('click', { seriesName: 'Revenue' }, (params) => {
  console.log(params.name, params.value, params.dataIndex);
});
Remove handlers with `off()` or dispose the instance during teardown; route remounts can otherwise register the same callback more than once.
Add wheel and slider zoom controls zoom-large-series
chart.setOption({
  dataZoom: [
    { type: 'inside', start: 70, end: 100 },
    { type: 'slider', start: 70, end: 100 },
  ],
  xAxis: { type: 'time' },
  yAxis: { type: 'value' },
  series: [{ type: 'line', data: points, showSymbol: false }],
});
In 6.1, tooltip formatter callbacks receive the raw input index after `dataZoom`, so recheck code that previously indexed filtered data.
Feed multiple series from one dataset share-tabular-dataset
chart.setOption({
  dataset: {
    source: [
      ['month', 'Sales', 'Returns'],
      ['Jan', 120, 8],
      ['Feb', 150, 11],
    ],
  },
  xAxis: { type: 'category' },
  yAxis: {},
  series: [{ type: 'bar' }, { type: 'line' }],
});
ECharts infers dimensions from the first row here. Set `seriesLayoutBy` or `encode` when rows and columns do not match that convention.
Format tooltip values without HTML format-tooltip-safely
chart.setOption({
  tooltip: {
    trigger: 'axis',
    valueFormatter: (value) =>
      typeof value === 'number' ? `${value.toFixed(1)} ms` : String(value),
  },
});
A string-returning `tooltip.formatter` can create HTML. Prefer `valueFormatter` for plain values, and escape untrusted text when custom HTML is unavoidable.
Enable generated chart descriptions render-accessible-chart
chart.setOption({
  aria: {
    enabled: true,
    decal: { show: true },
  },
  title: { text: 'Quarterly revenue' },
  series,
});
ARIA text does not make every plotted value navigable. Keep a visible summary or data table for information users must inspect precisely.
Export the rendered chart export-chart-image
const pngUrl = chart.getDataURL({
  type: 'png',
  pixelRatio: 2,
  backgroundColor: '#ffffff',
});
Cross-origin images without the right CORS headers can taint a Canvas and make export fail; test maps, symbols, and background images on the deployed origin.
Synchronize interactions across two charts connect-dashboard-charts
const traffic = echarts.init(trafficElement);
const errors = echarts.init(errorsElement);

traffic.group = 'ops';
errors.group = 'ops';
echarts.connect('ops');
Connected instances relay actions such as zoom and highlighting. Give both charts compatible axis domains or the shared interaction can be confusing.
Initialize the SVG renderer use-svg-renderer
import { SVGRenderer } from 'echarts/renderers';

echarts.use([SVGRenderer]);
const chart = echarts.init(element, undefined, {
  renderer: 'svg',
});
SVG can suit smaller charts and DOM-based export, while Canvas is usually the safer choice for dense marks. Measure with your actual series count.
Alternatives
| Package | Registry | Pick it when |
|---|---|---|
| chart.js | npm | Choose Chart.js for familiar dashboard charts when its smaller set of chart types and plugin model covers the job. |
| uplot | npm | Choose uPlot for compact, high-volume time-series plots when you can give up ECharts' broad component and chart catalogue. |
| plotly.js | npm | Choose Plotly.js when scientific plots, 3D traces, and built-in analysis controls matter more than payload size. |
| highcharts | npm | Choose Highcharts when its commercial support and accessibility work justify reviewing the licence for your use case. |
More web frontend guides
postcss · react · react-dom · tailwindcss · htmlparser2 · tailwind-merge · the whole shelf →
How this guide is made: grounded in the library's documentation, release notes, changelog, and issue history, on a fixed rubric — not a hands-on install of every release. The 50 most-downloaded entries are additionally install-verified in clean containers. Corrections: contact the desk.